InfographicsAnimationsInteractiveIllustrationsLayout
Infographics
Click to enlarge.
Editorial
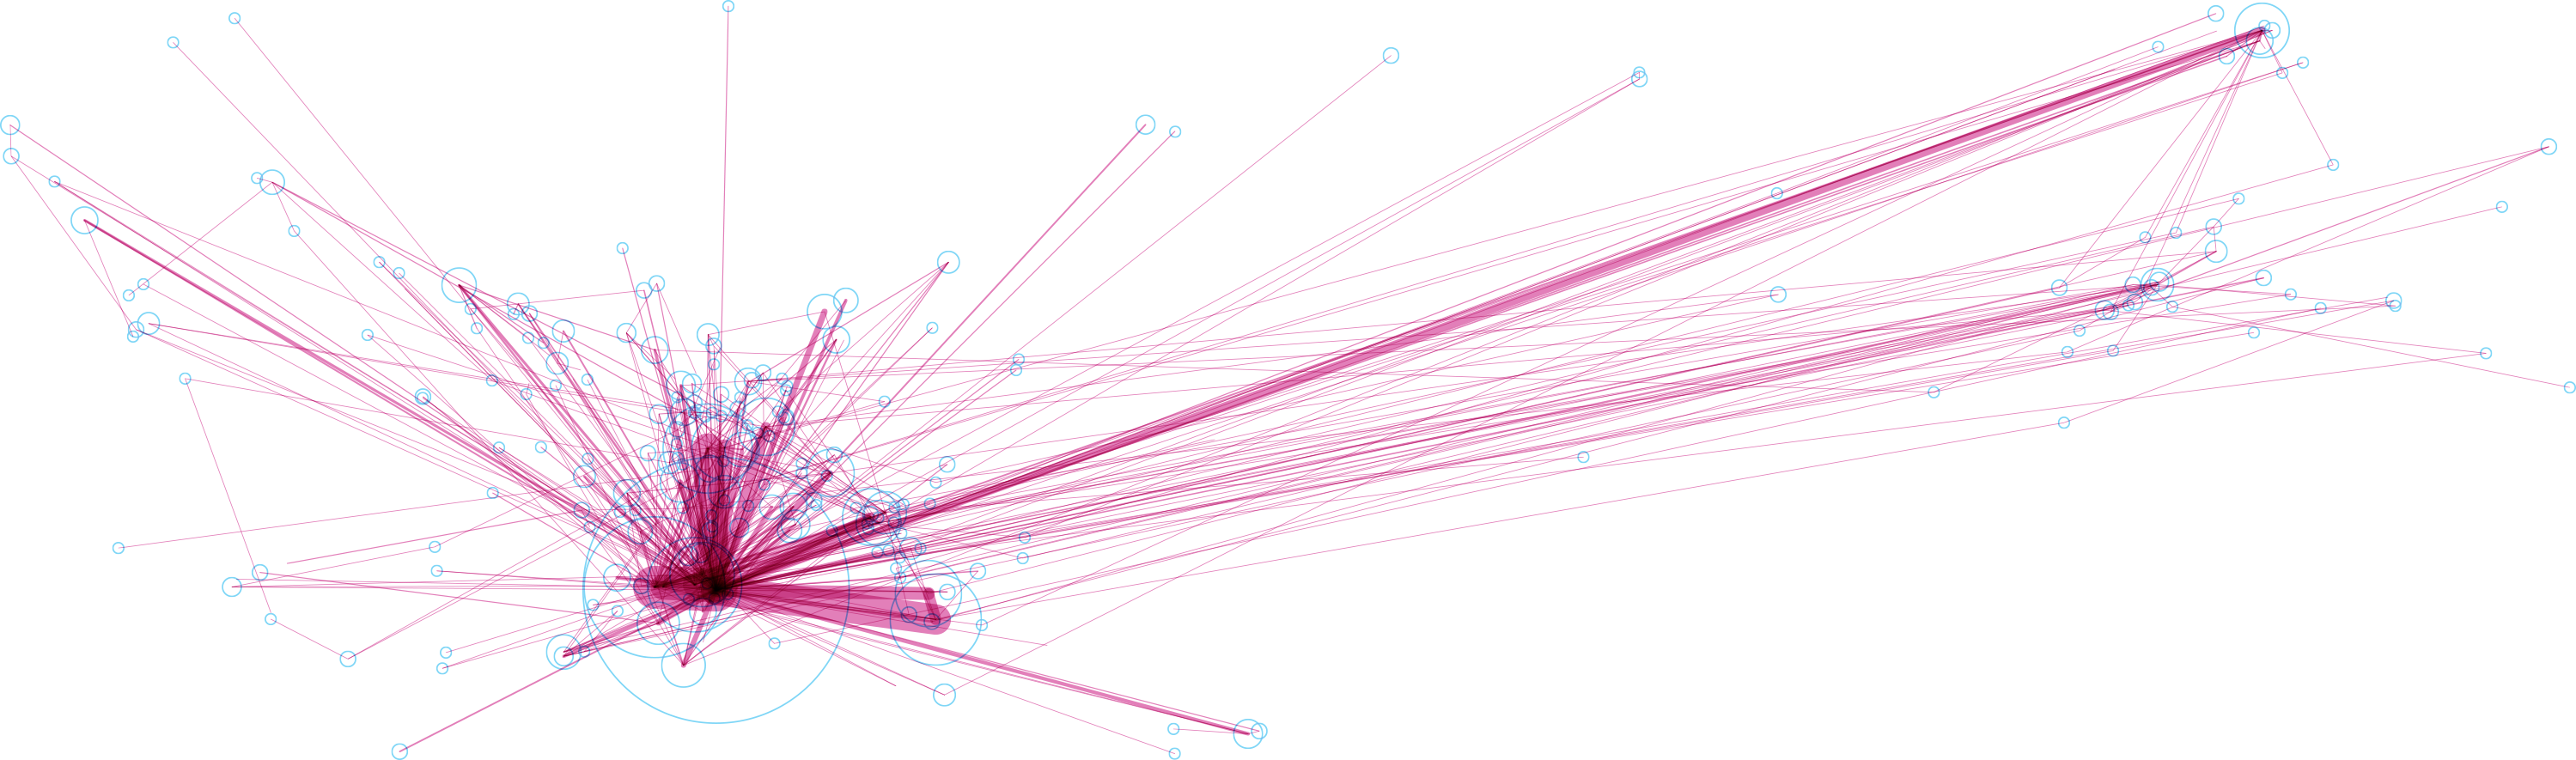
The number of coworkers within the police force that got involved after a shooting between criminals, which got one of them killed. (Svensk Polis)
Statistics about James Bond movies. Credits to informationisbeautiful.net for the research. (Sydsvenskan)
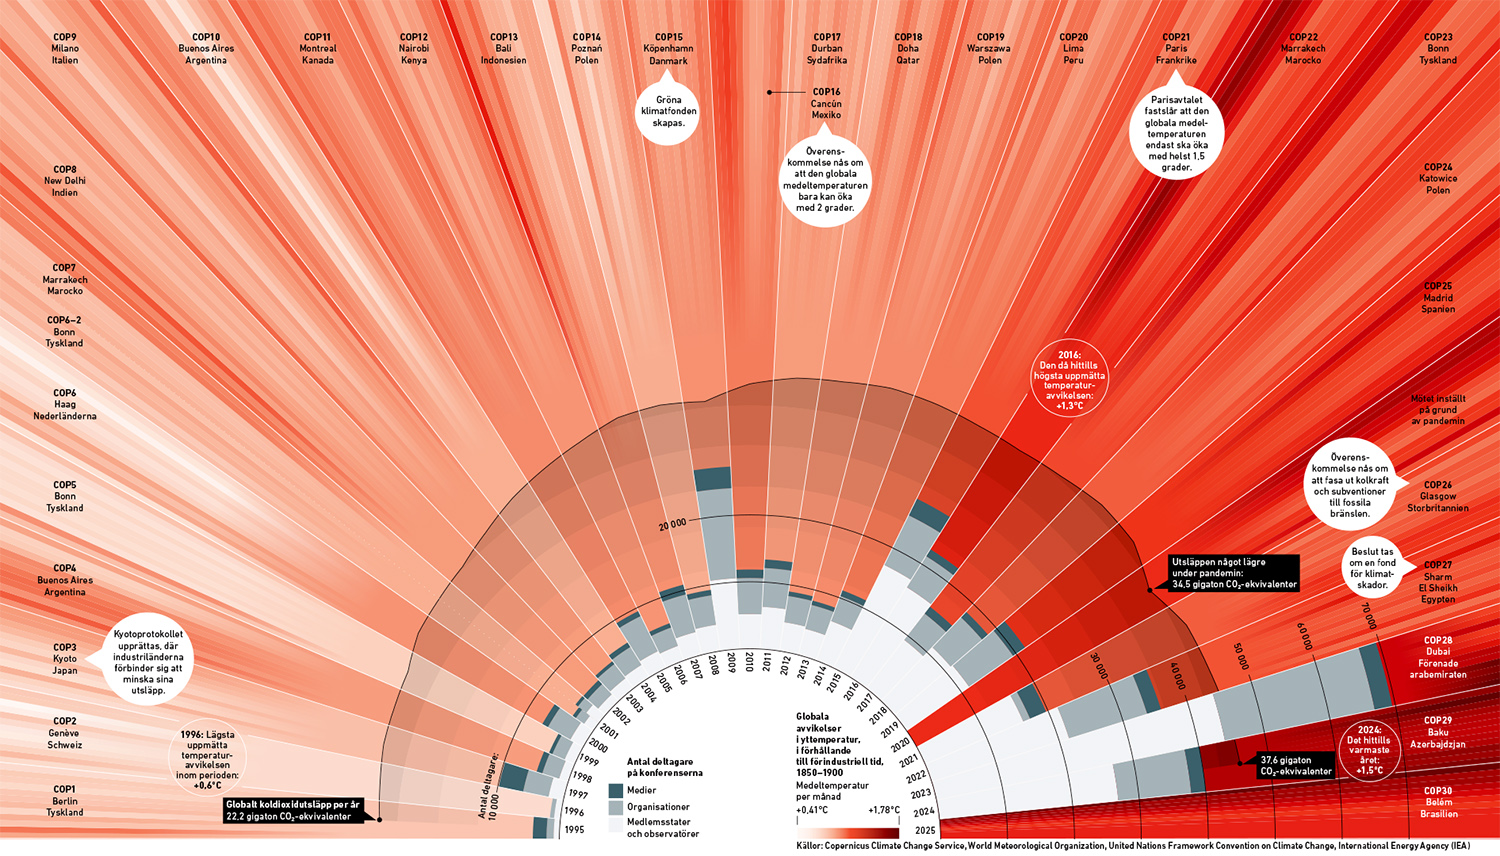
COP27. Participants and temperatures. (Sveriges Natur)
Illegal transports. (Sveriges Natur)
Statistics about hate crimes. (Polismuseet)
The Amazon rainforest is being cut down, and will probably continue that way. The infographic puts the values in perspective. (Sveriges Natur)
Risk factors for violent men. (Svensk Polis)
Statistics showing length of guitar solos. I listened and measured them and found out that they are getting shorter and fewer since Jimi Hendrix was playing. (Sydsvenskan)
Ear implants. (Funktion i fokus)
Statistics showing poll results prior to the presidential election 2012 in the USA. (Sydsvenskan)
Fatalaties and injuries caused by traffic. (Volvo Trucks)
Coal power statistics. (Sveriges Natur)
Timeline showing wine packaging through ages. (Tetra Pak)
Map showing the progress of IS, Islamic State. (Magasinet NEO)
Statistics showing comparison between SAS and Norwegian. (Sydsvenskan)
Forestry statistics. (Holmen magasin)
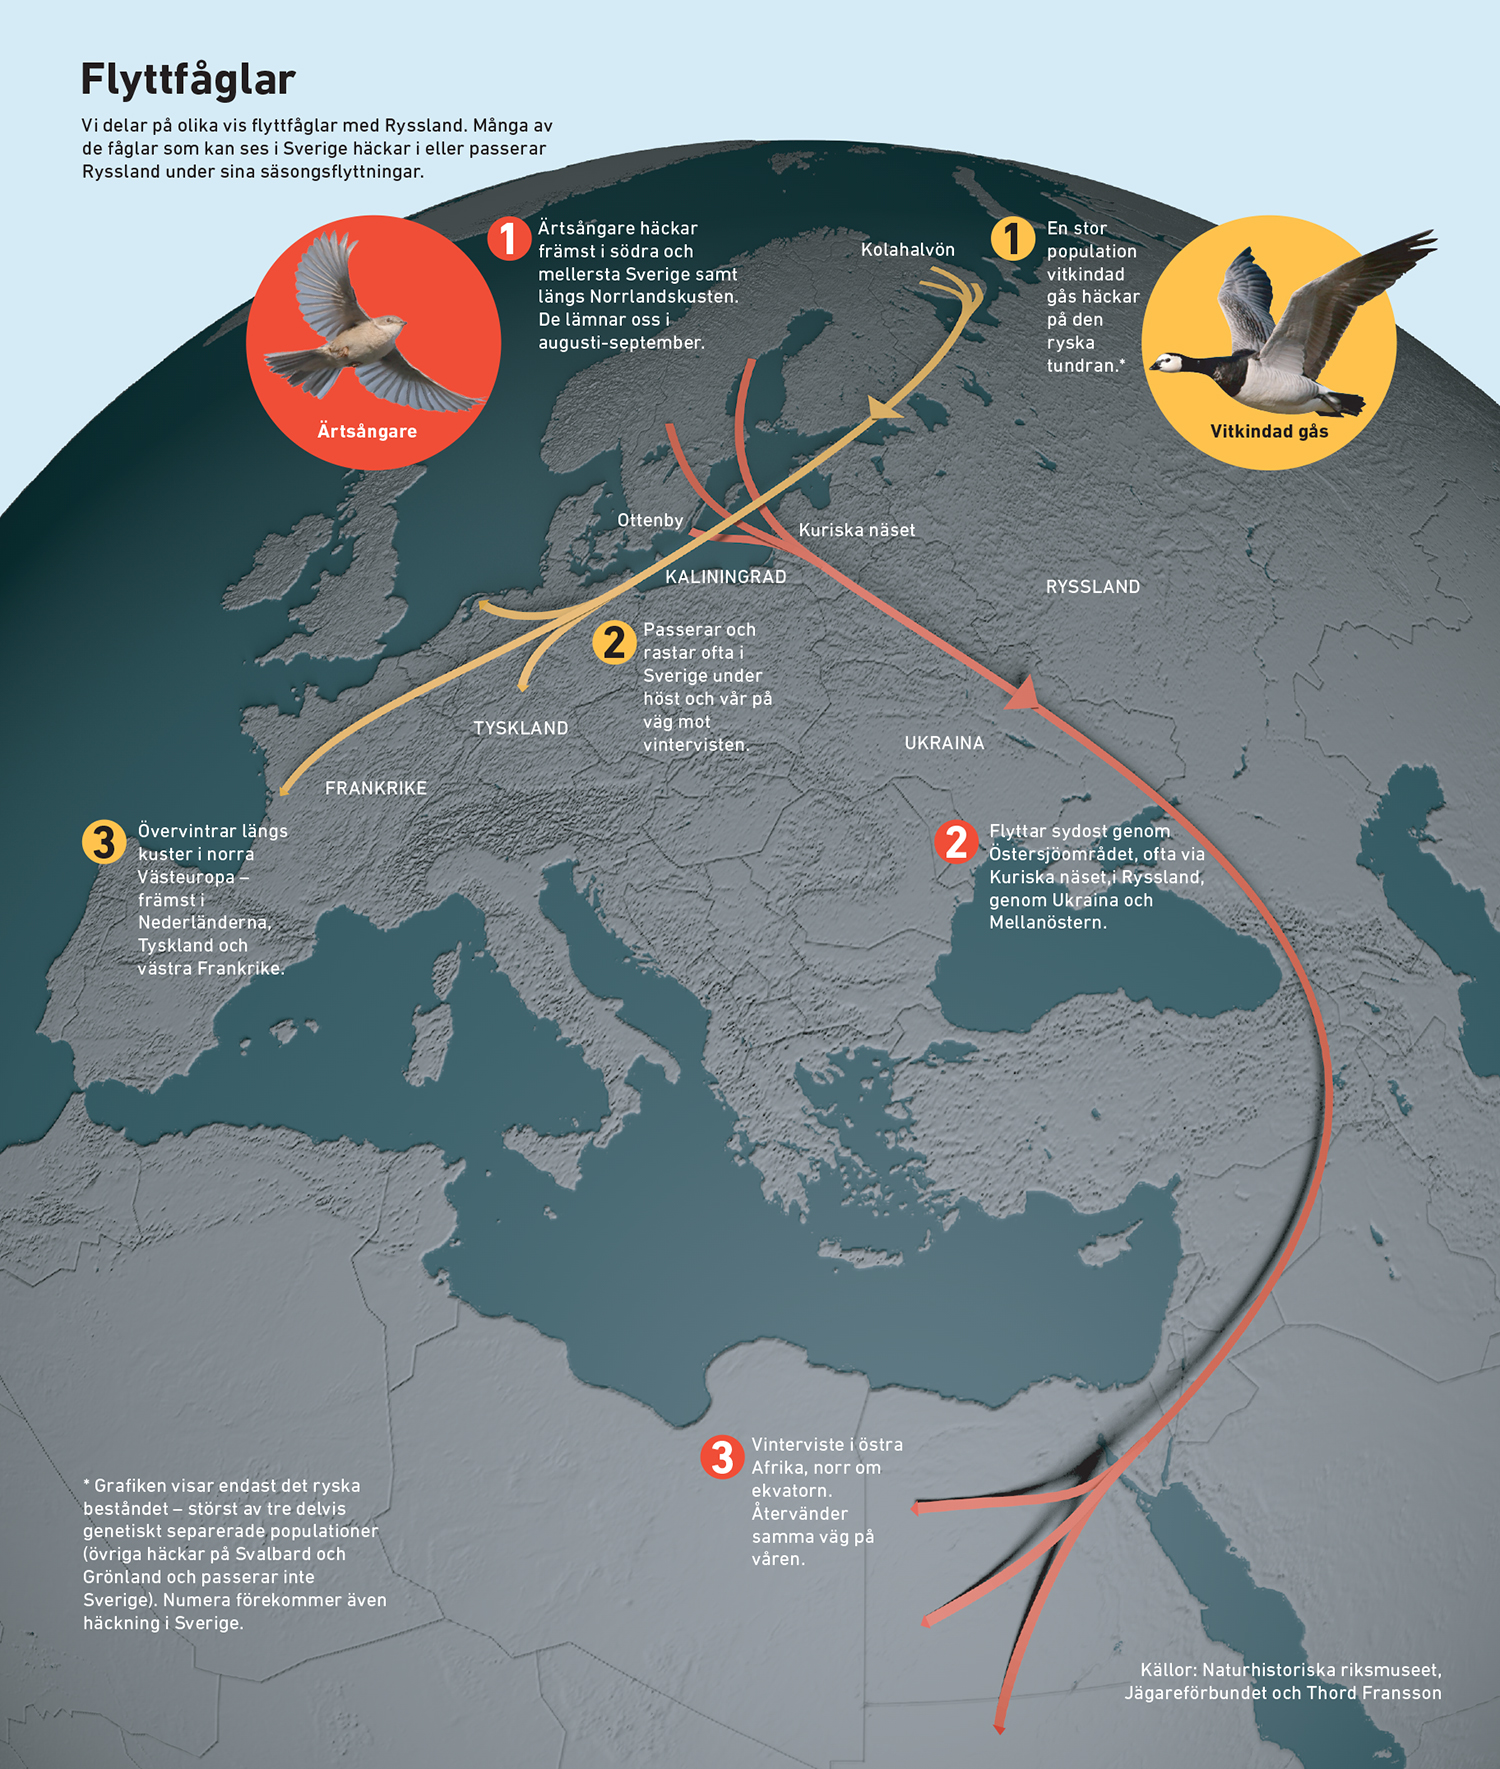
Migratory birds movements. (Sveriges Natur)
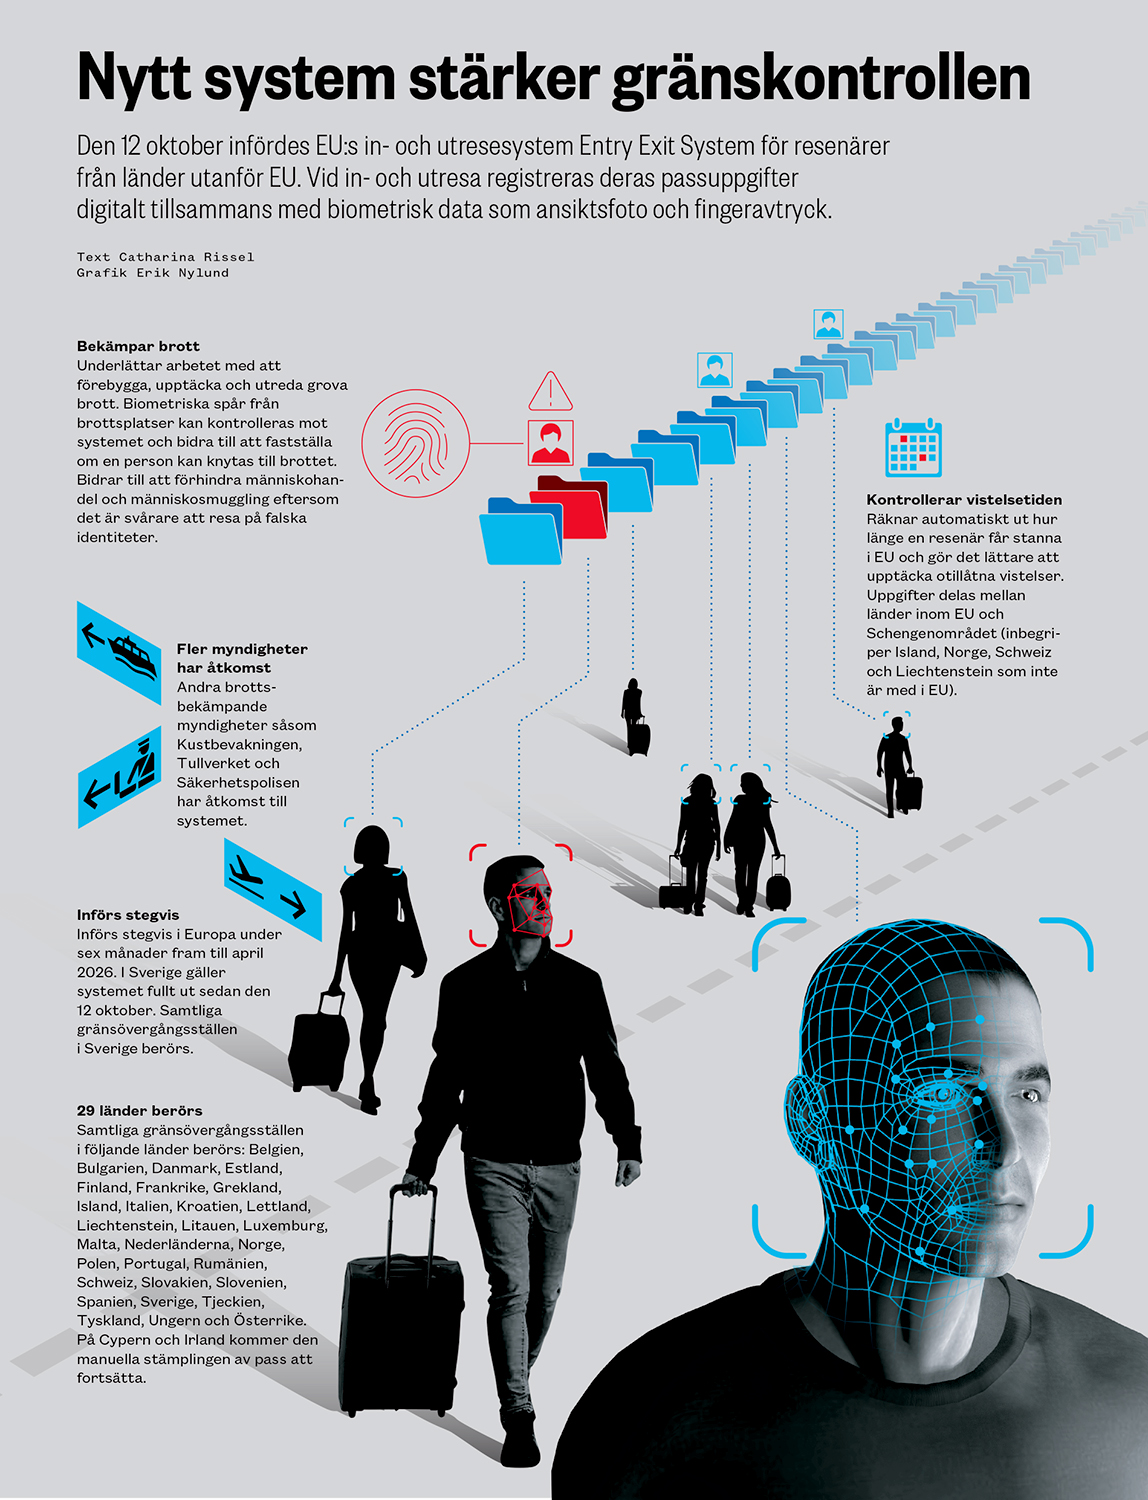
Migratory birds statistics. (Sveriges Natur)
Relation between income and carbon dioxide emissions. (Sveriges Natur)
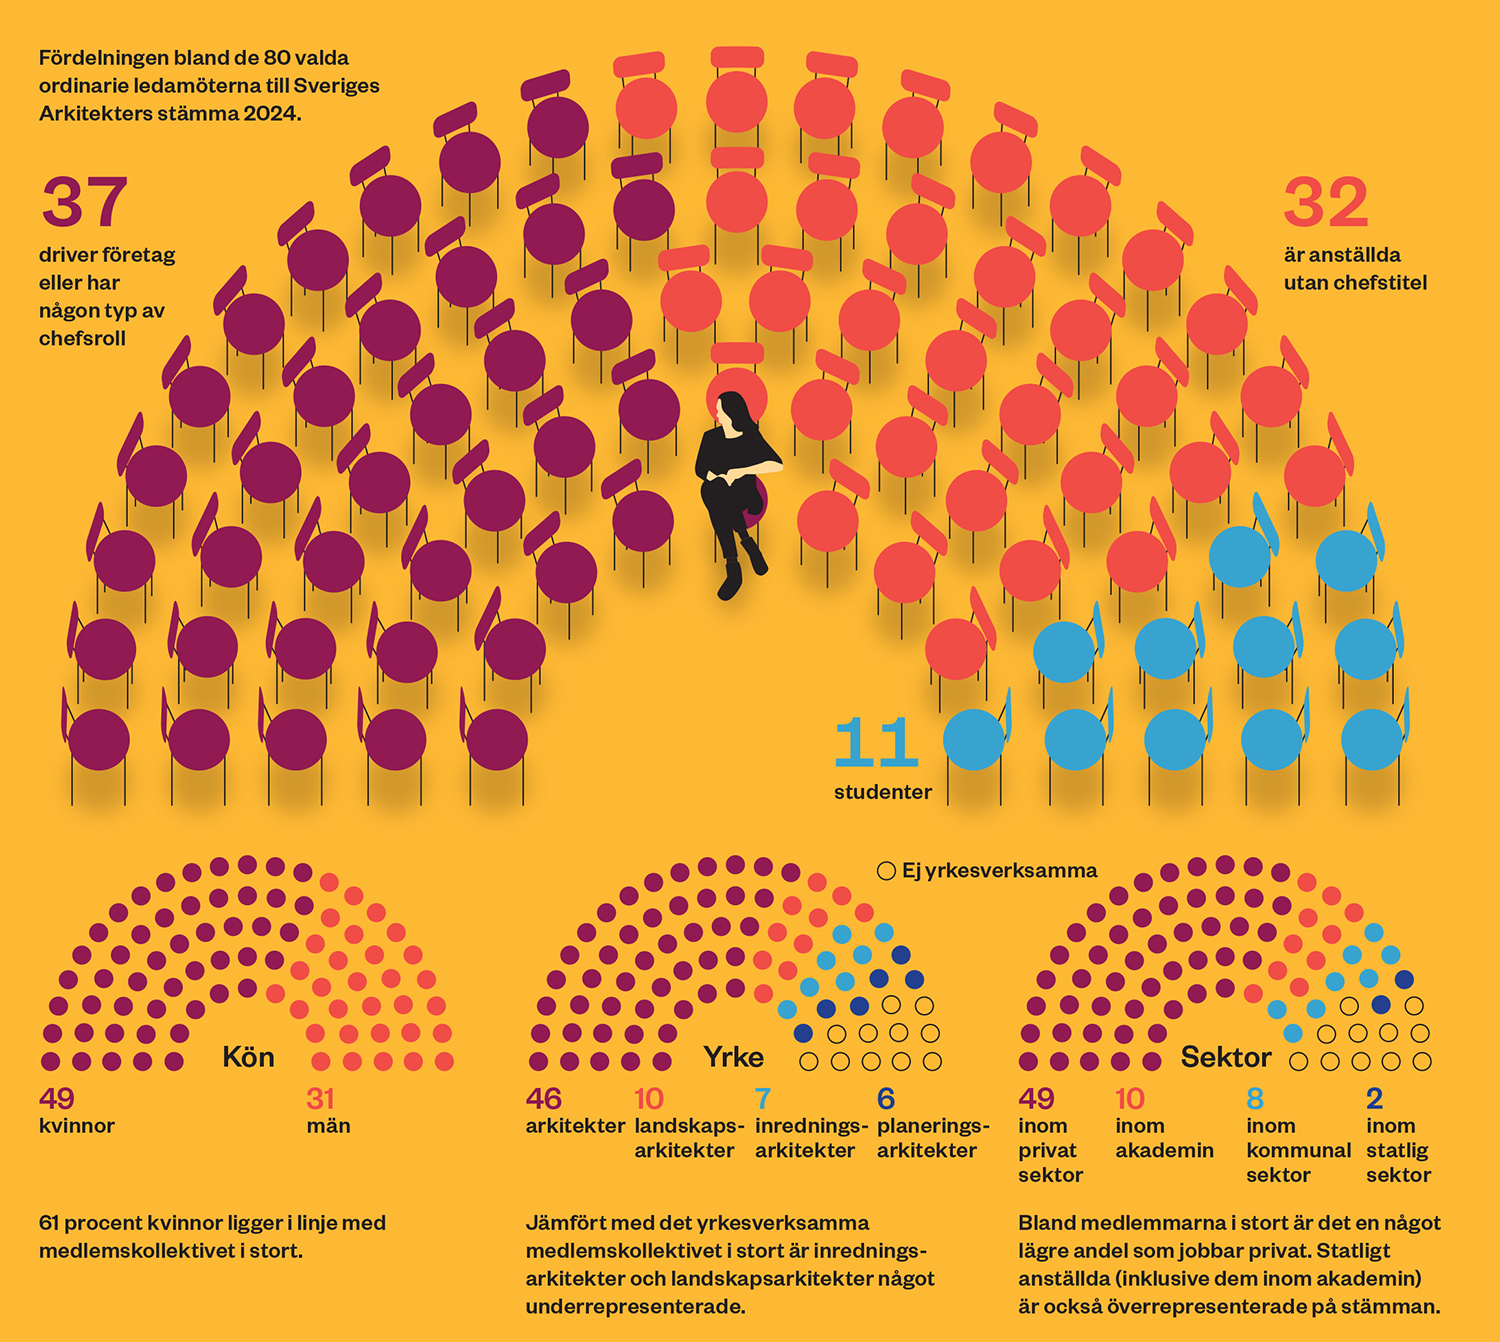
Board statistics. (Arkitekten)
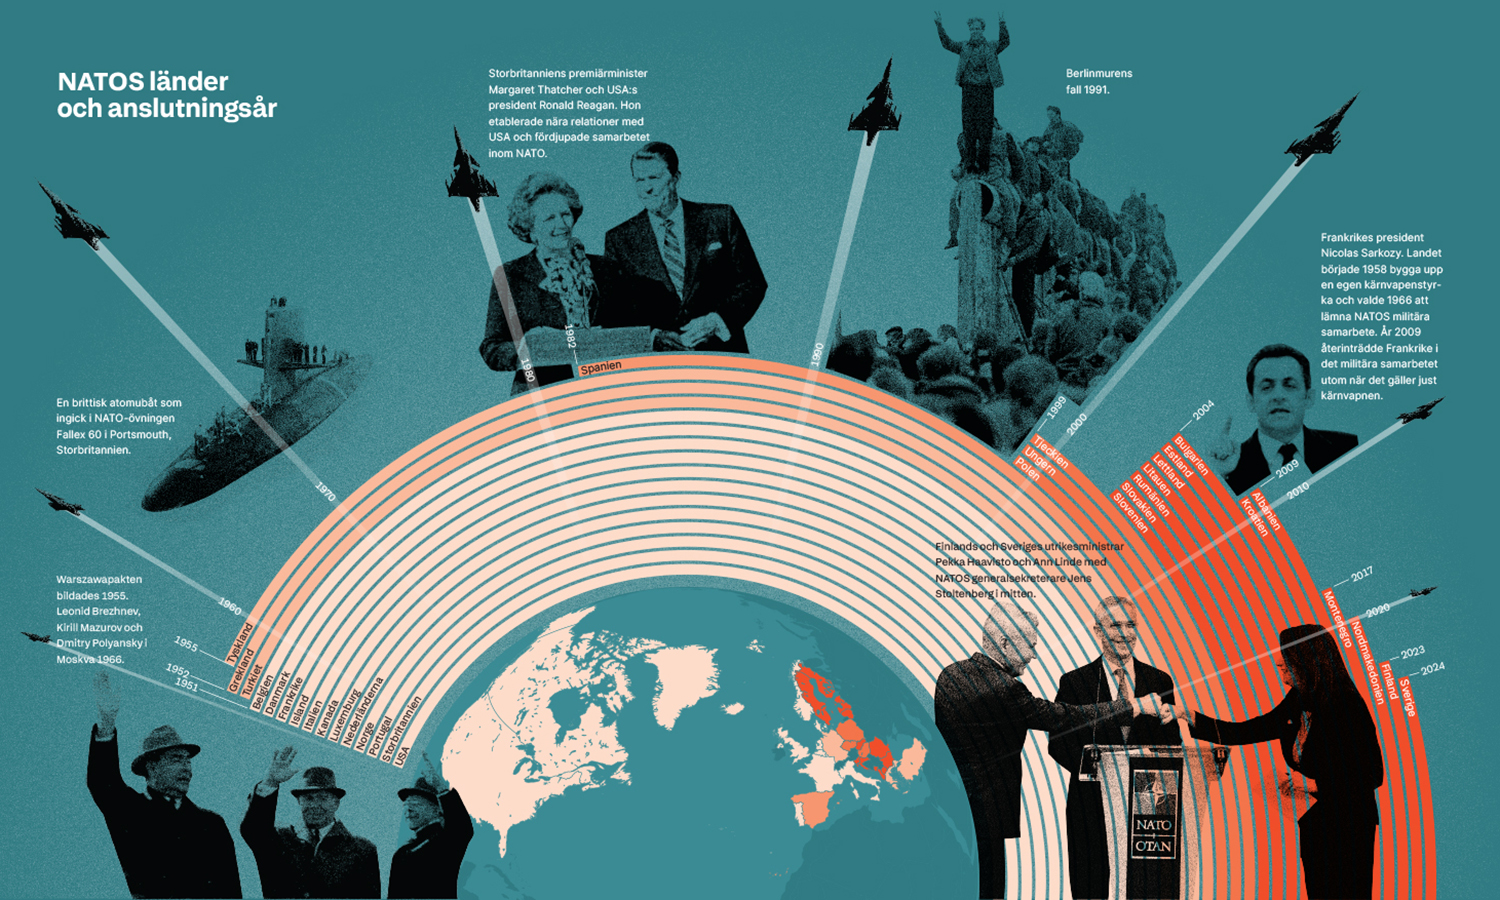
NATO membership. (Nationalencyklopedin)
Meat production statistics. (Perstorp)
Computer game timeline. (Åbo Akademi)
Statistics showing artists making their best album when they are around 30. Based on my own albumcollection. And my own opinions. (Helsingborgs Dagblad)
Explanatory graphic showing the principles of heat exchangers. (Tetra Pak)
Statistics about the average person from Helsingborg. (Helsingborgs Dagblad)
Statistics about energy sources and energy usage within cloud service companies. (Camino)
Map showing where minerals are produced. (Sandvik Magasin)
Statistics about newspaper production between 1800 and 1900. 3×1 meters large, made for an exhibition at British Library.
Educational / Scientific
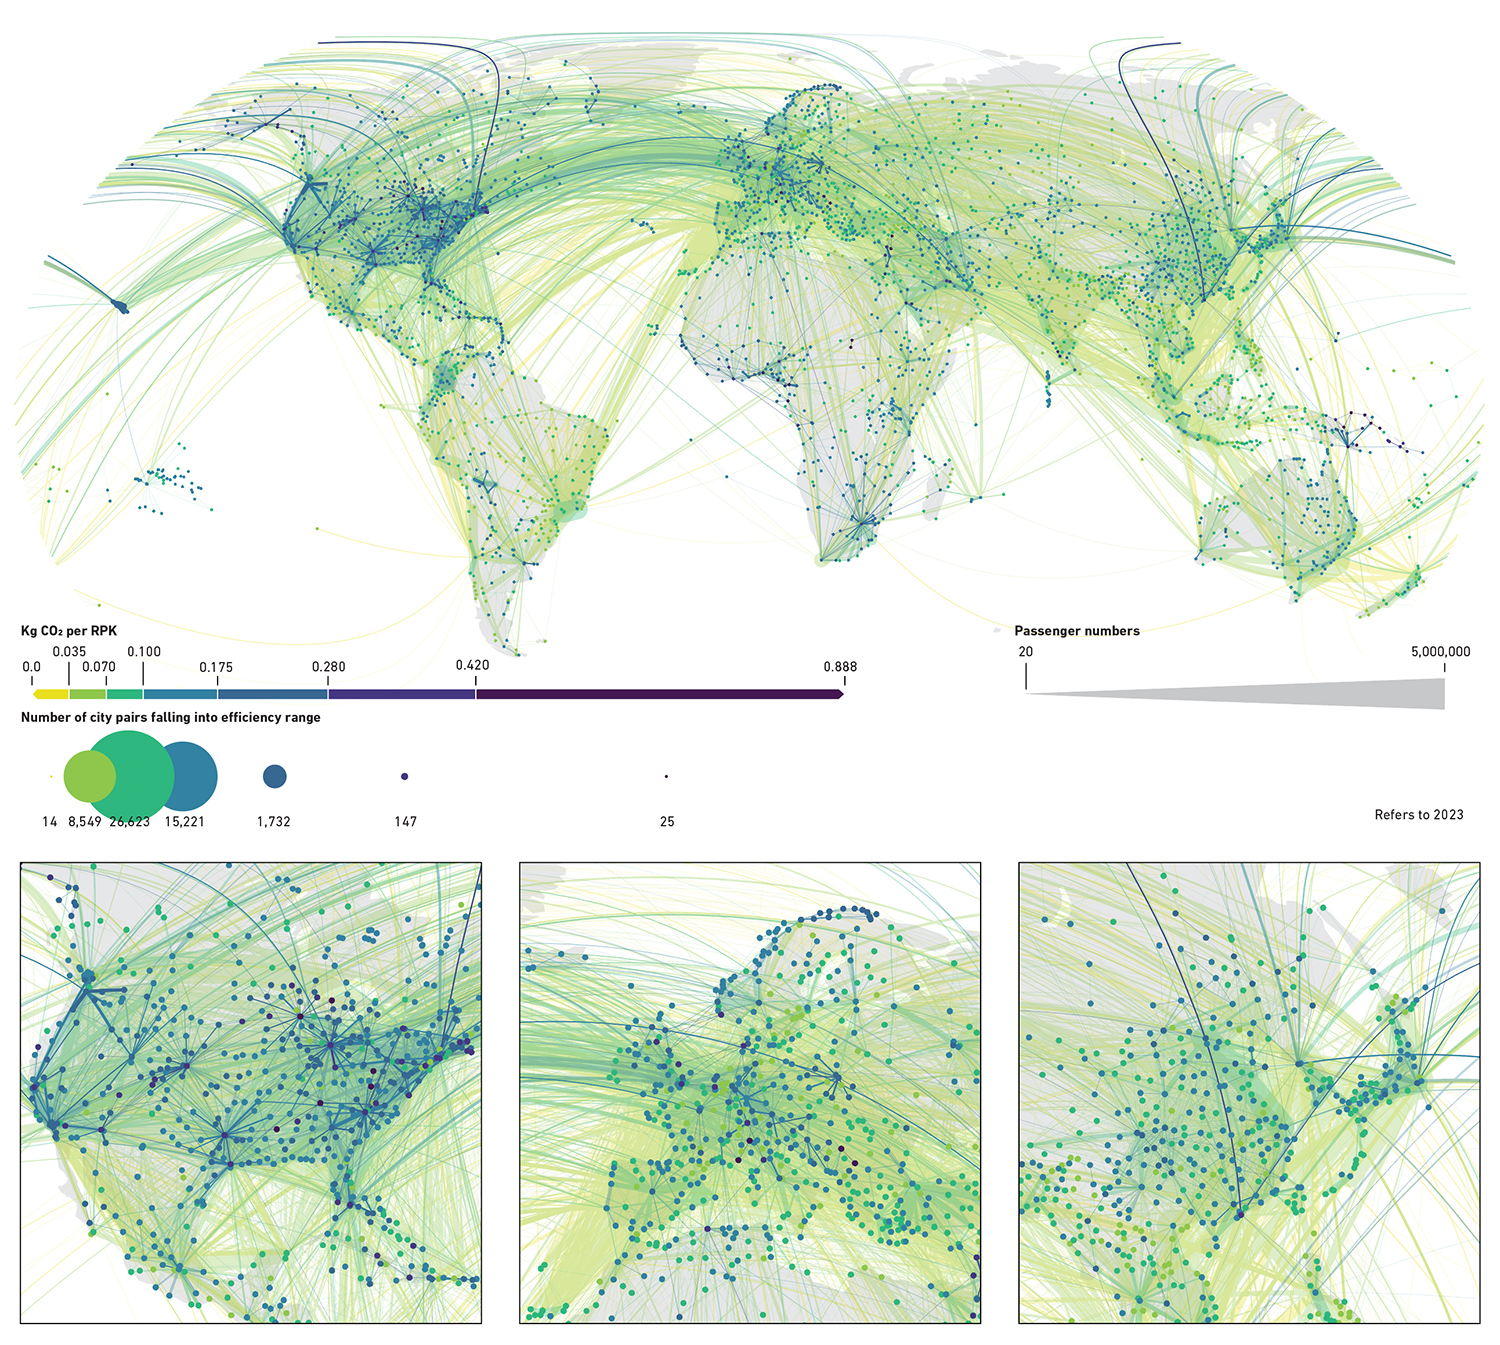
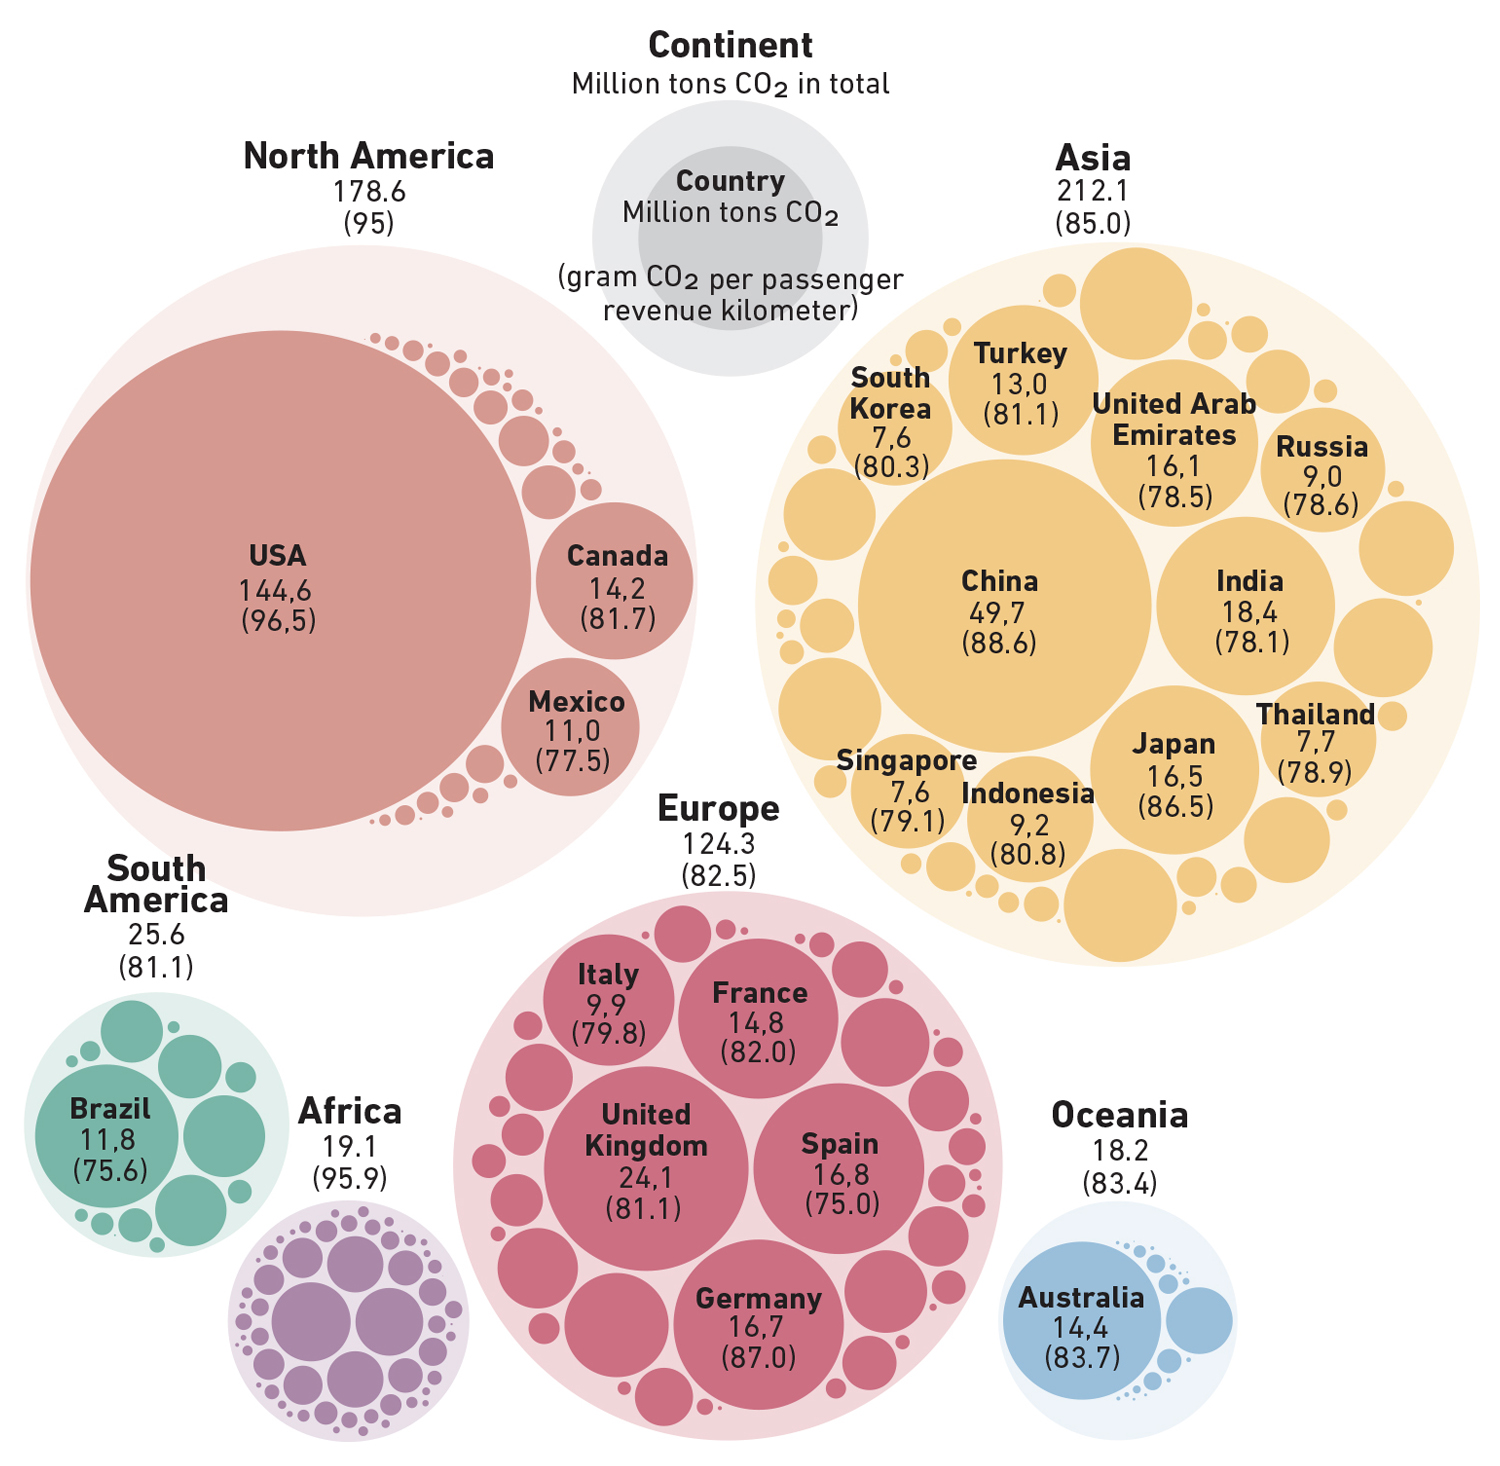
Emissions.
Food emissions.
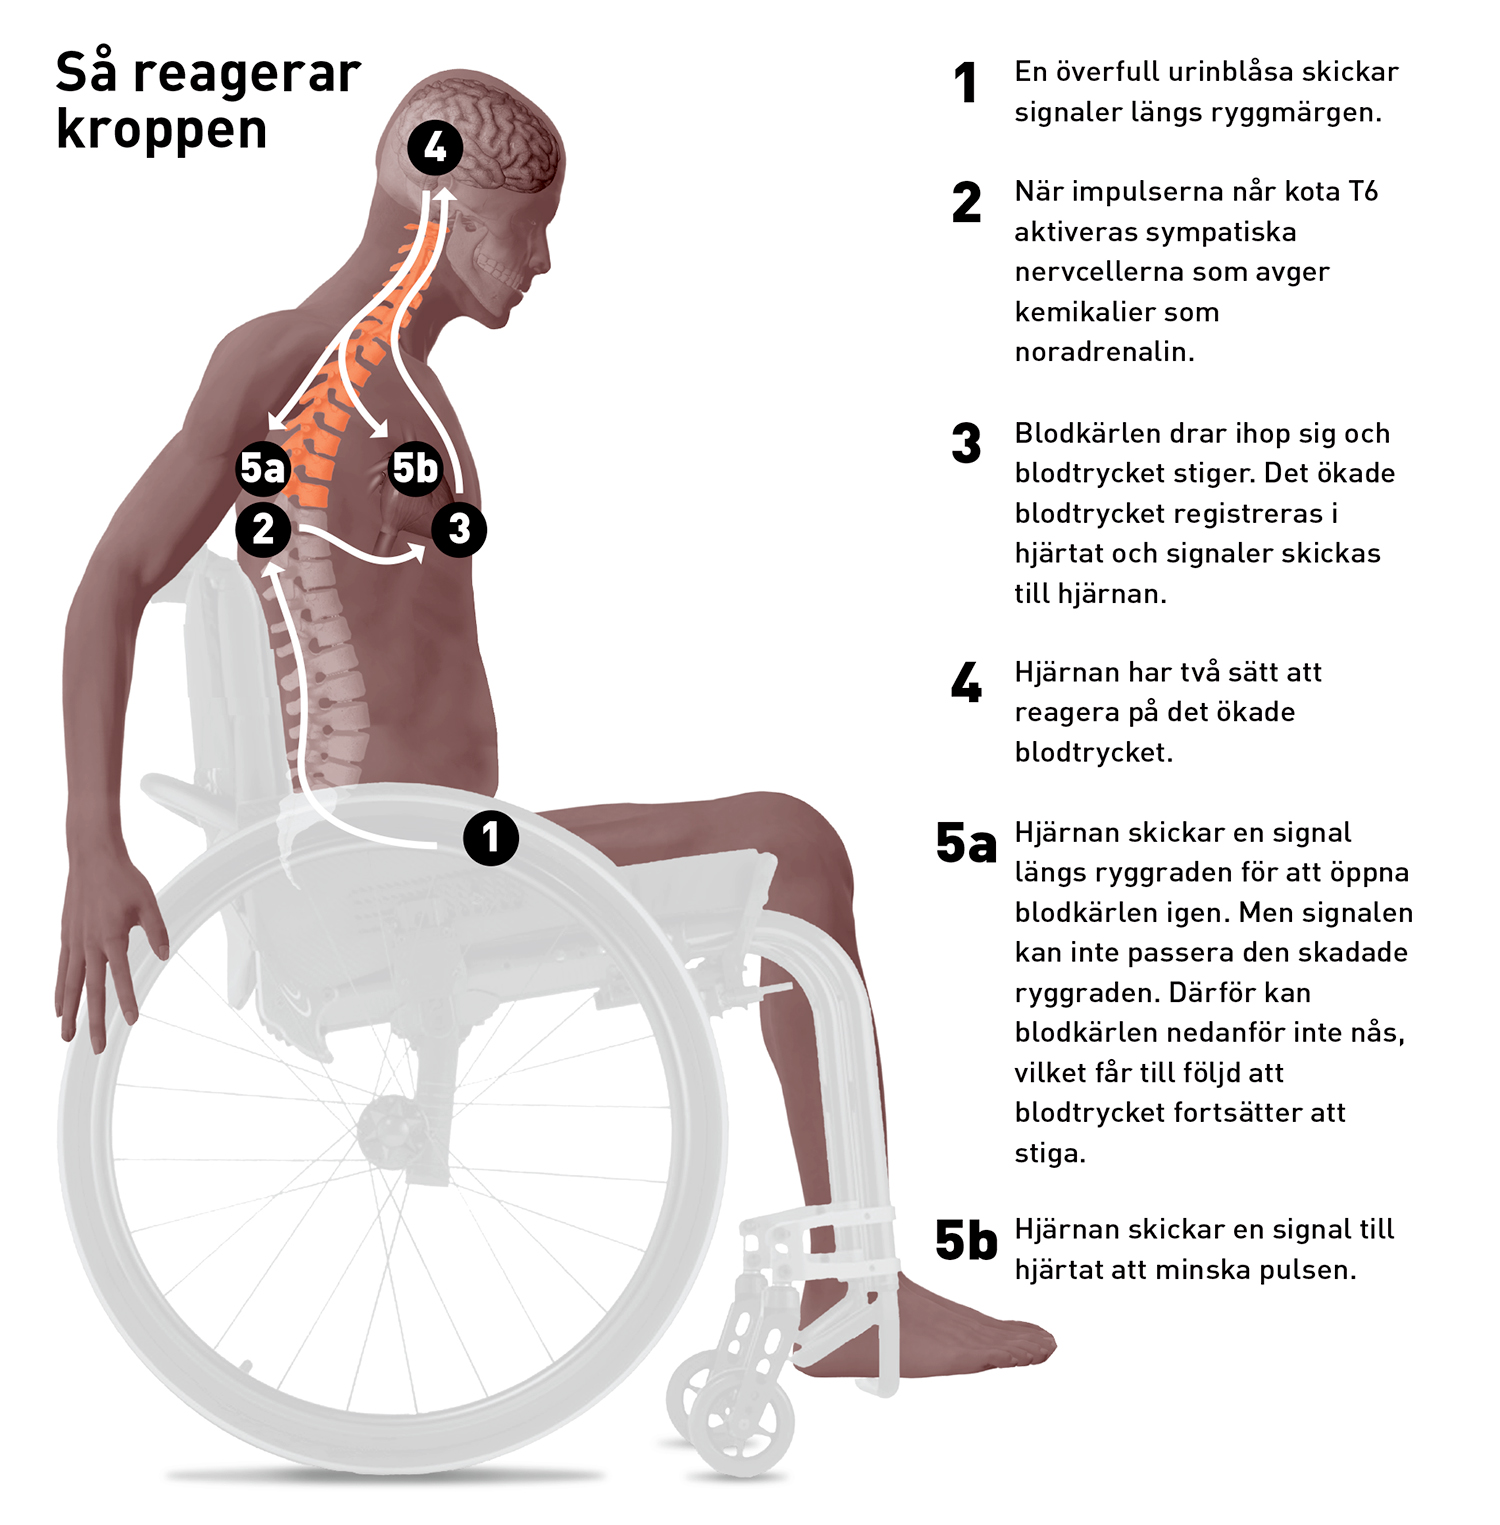
Spinal injury.
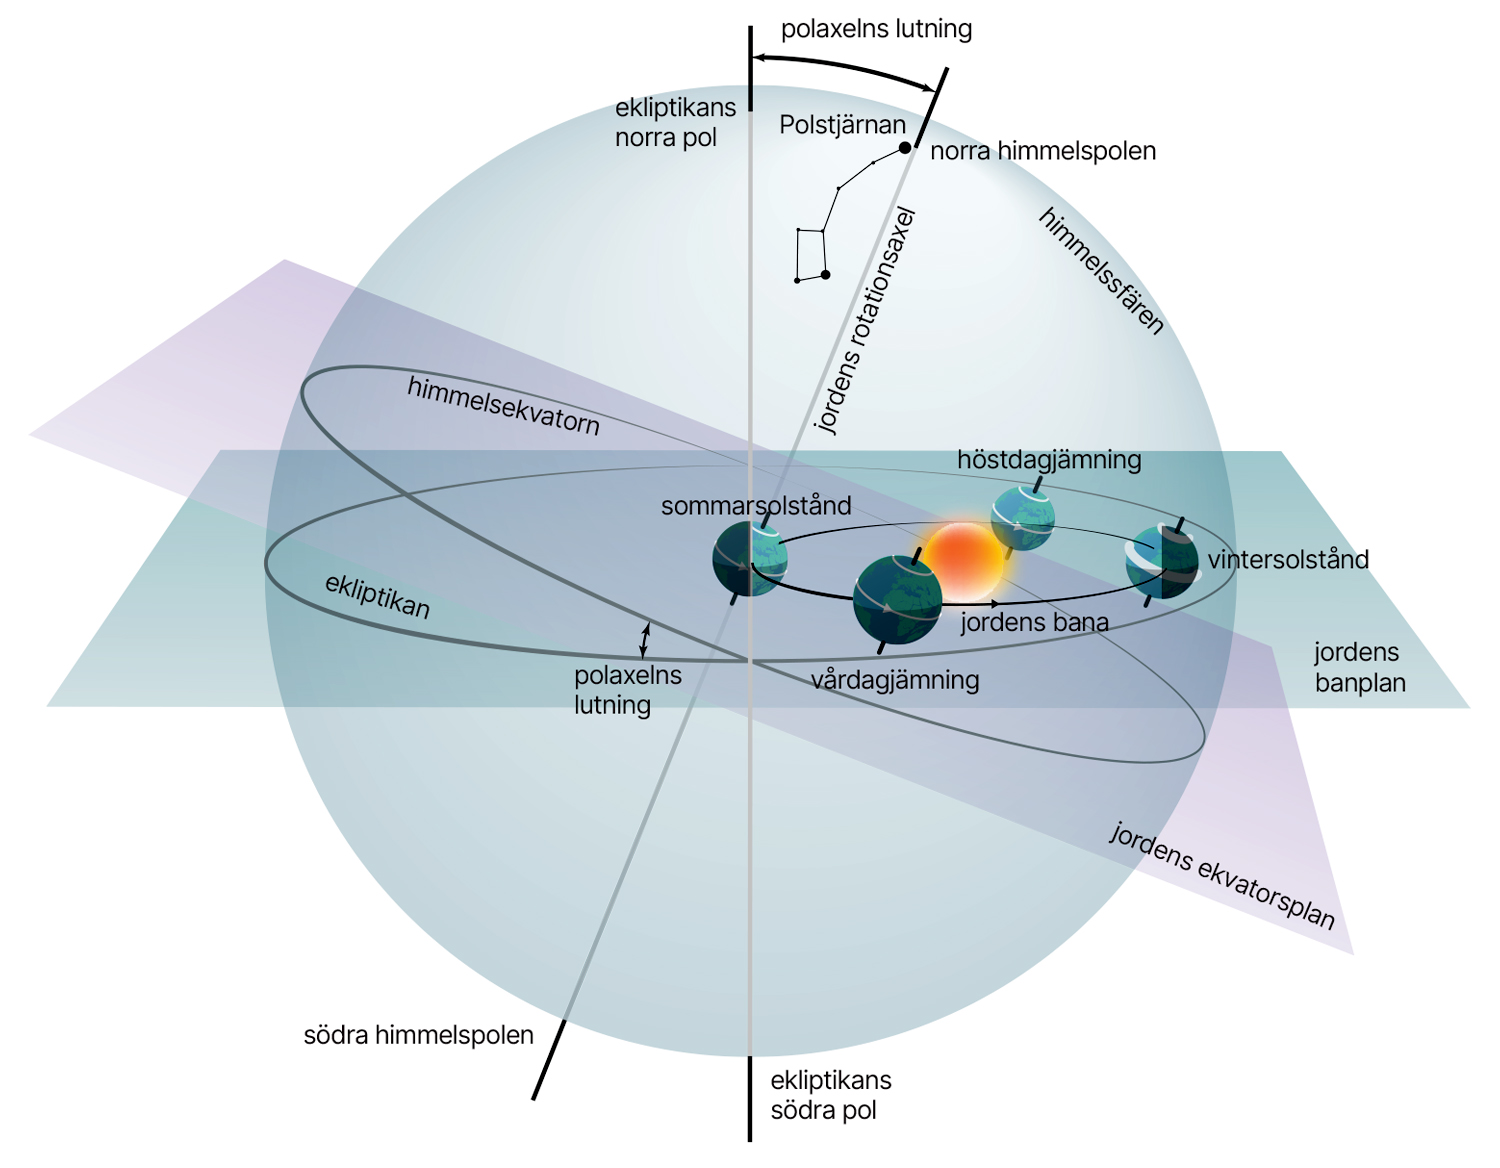
Earth orbit. (Nationalencyklopedin)
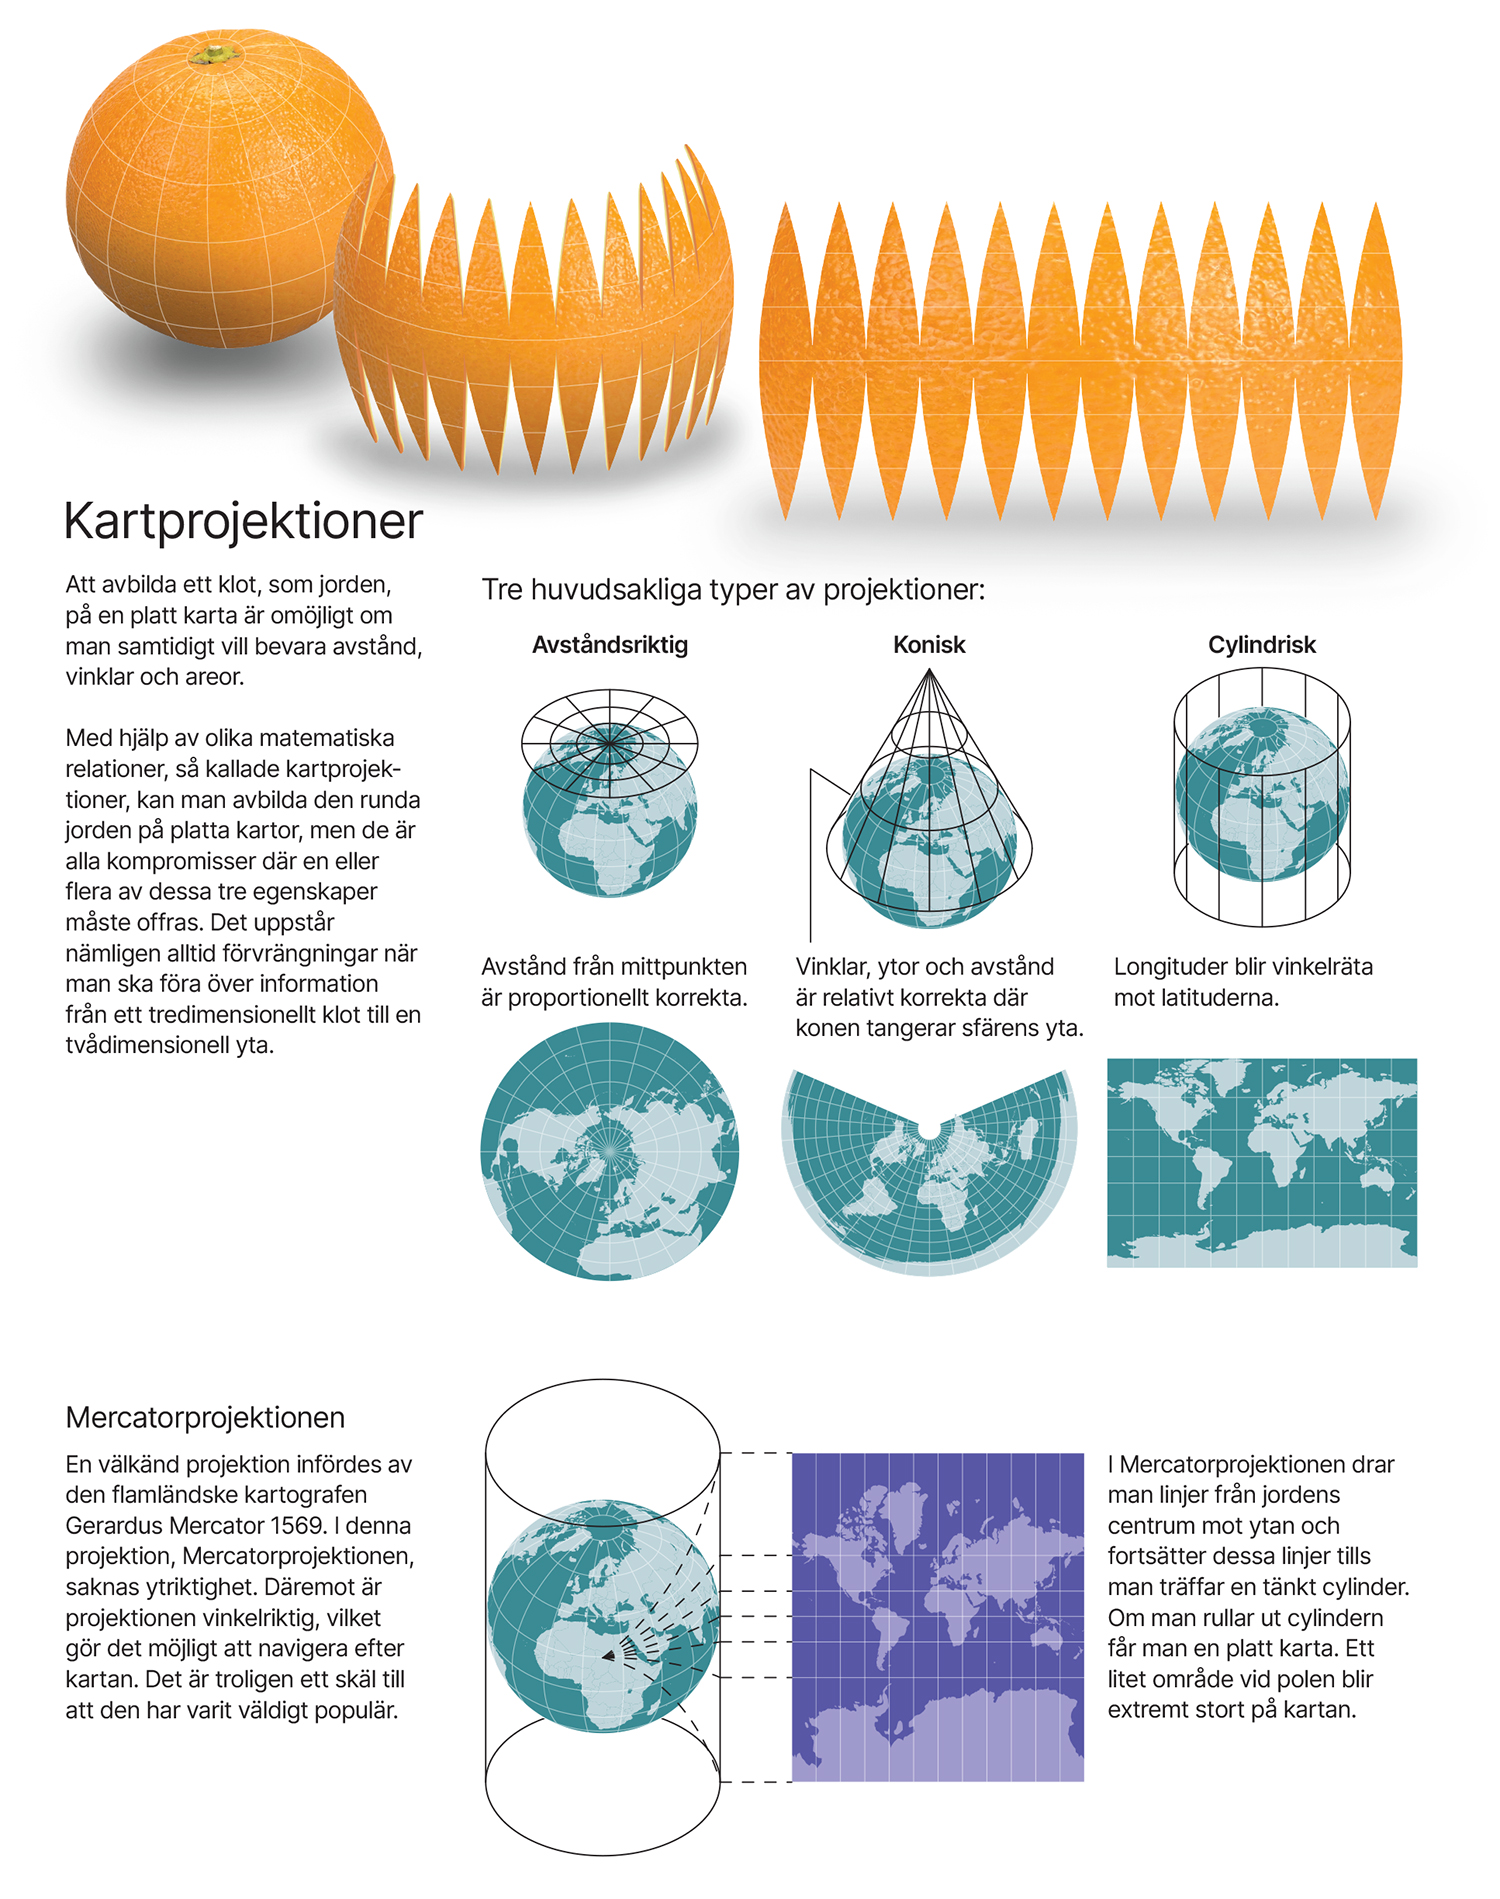
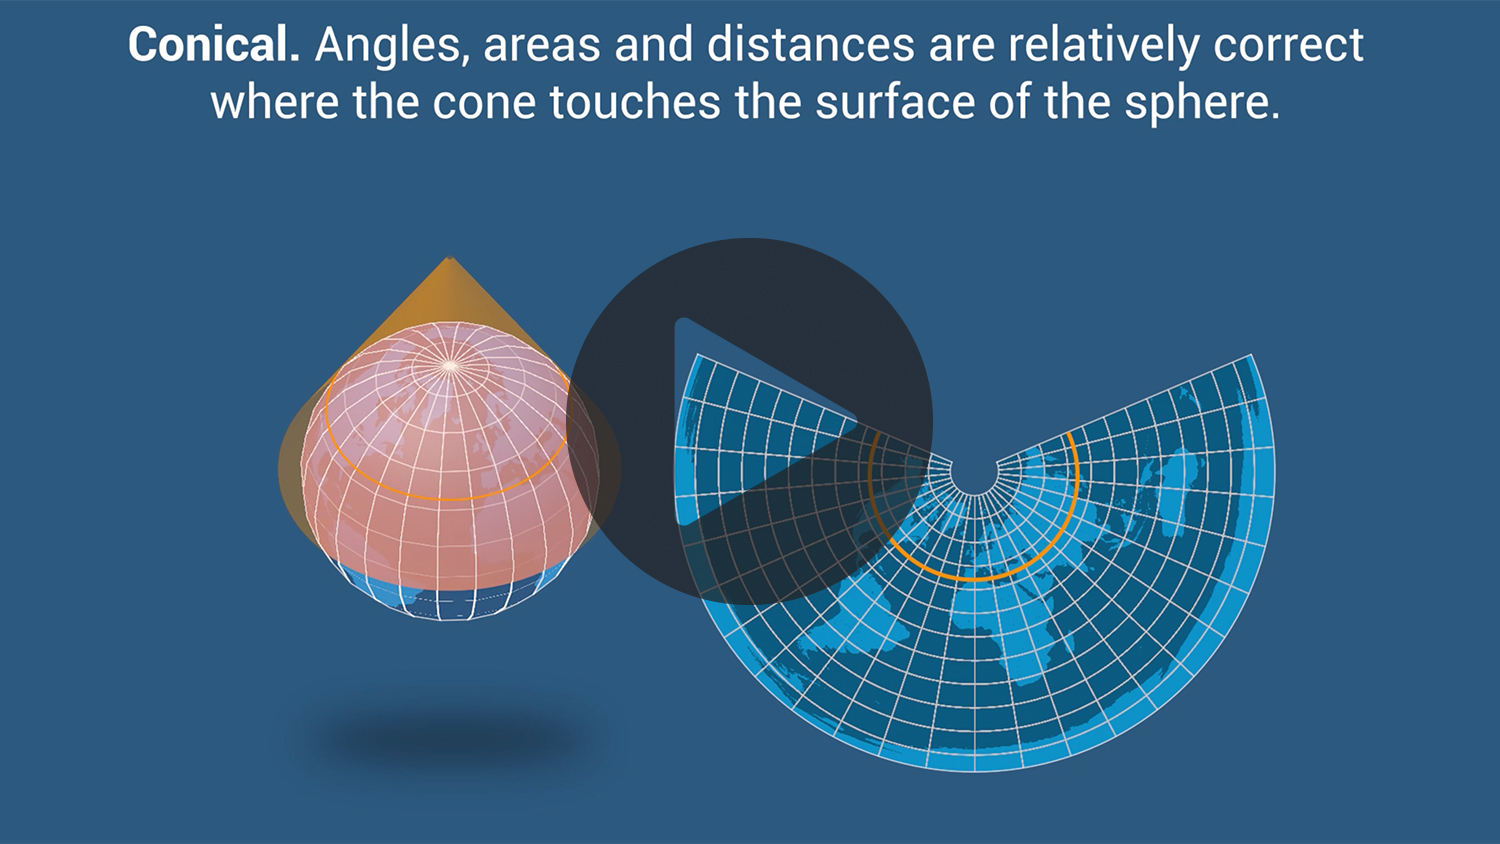
Map projections. (Nationalencyklopedin)
Food emissions.
Statistics about the summerweather. (Sydsvenskan)
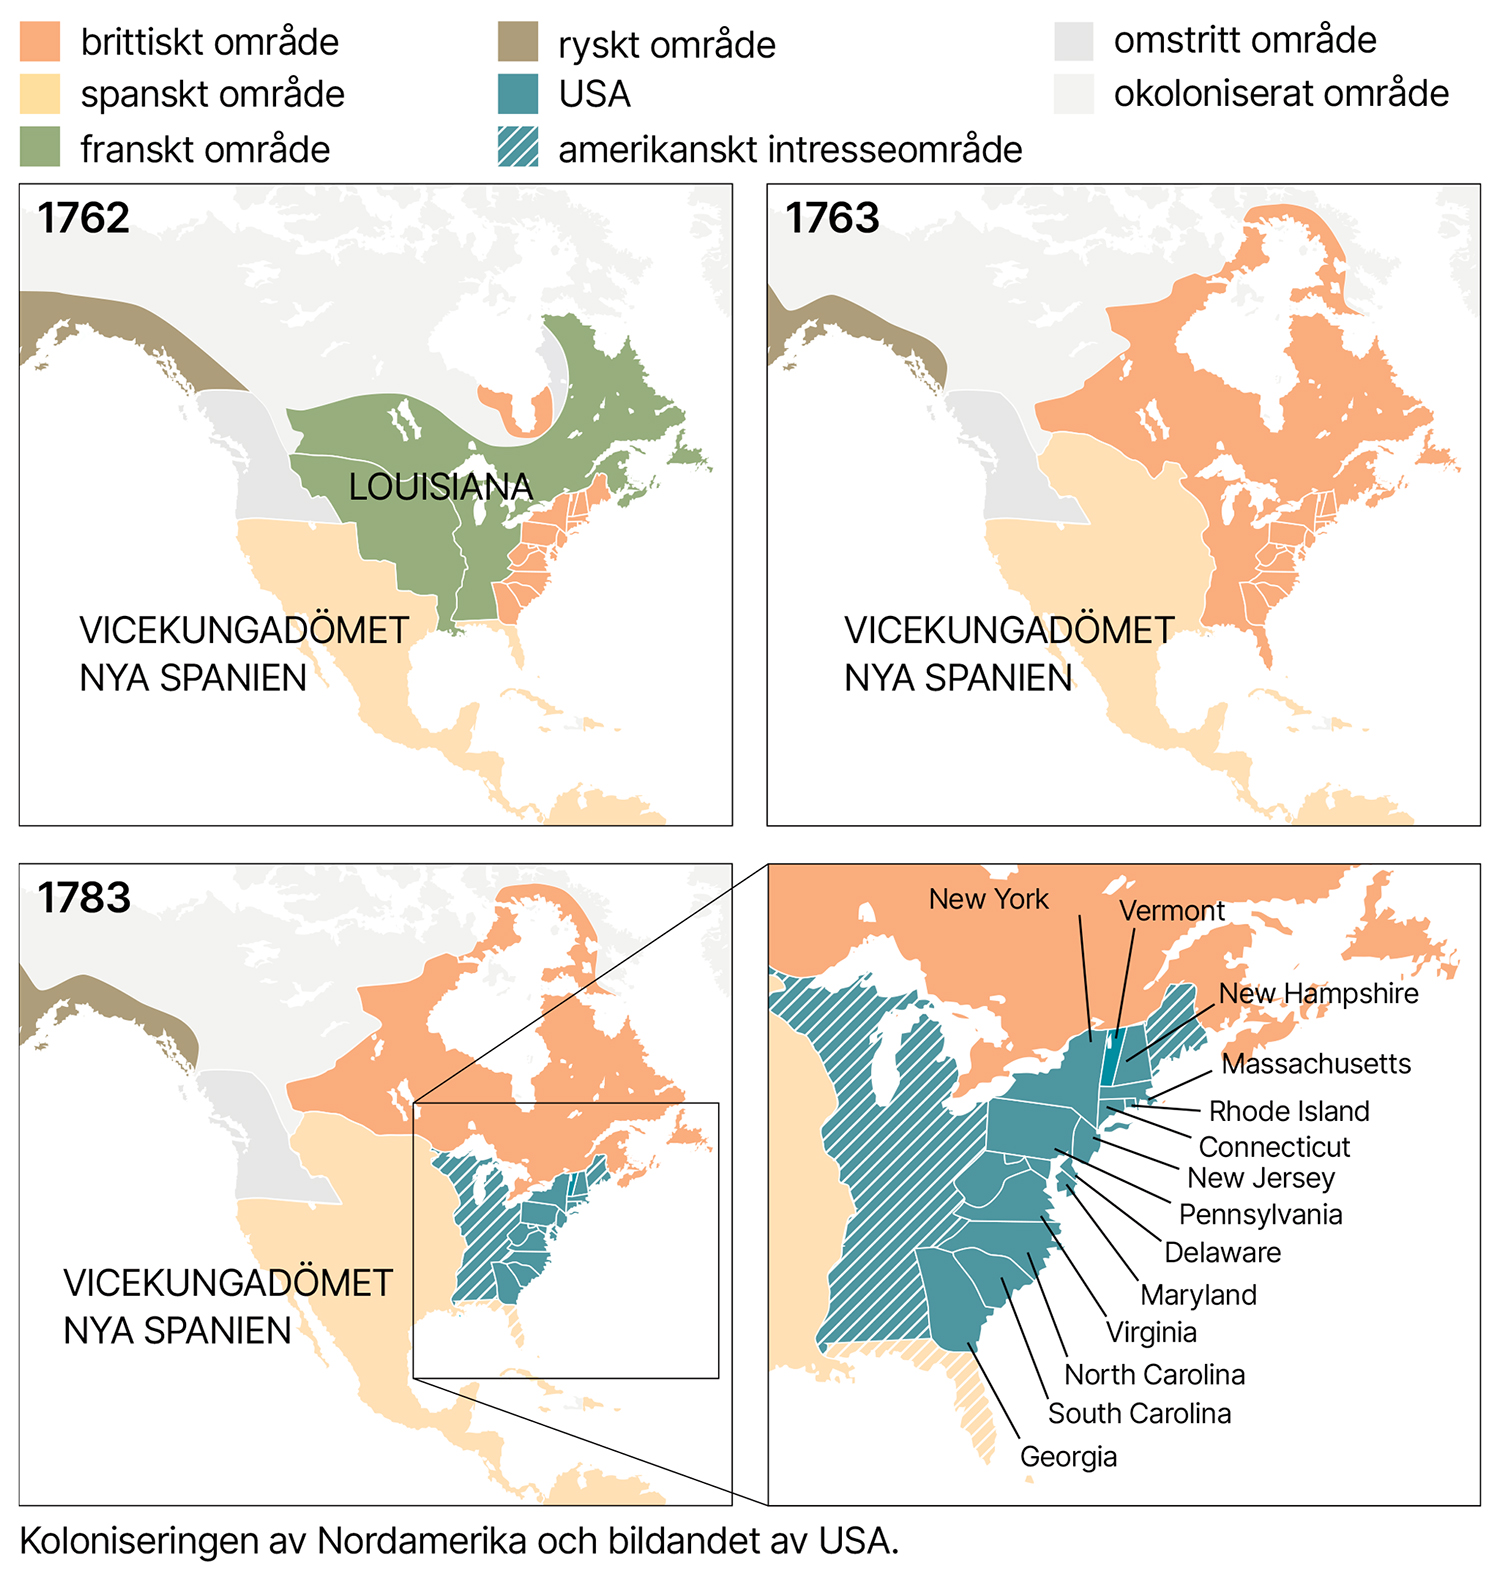
Colonization of North America.
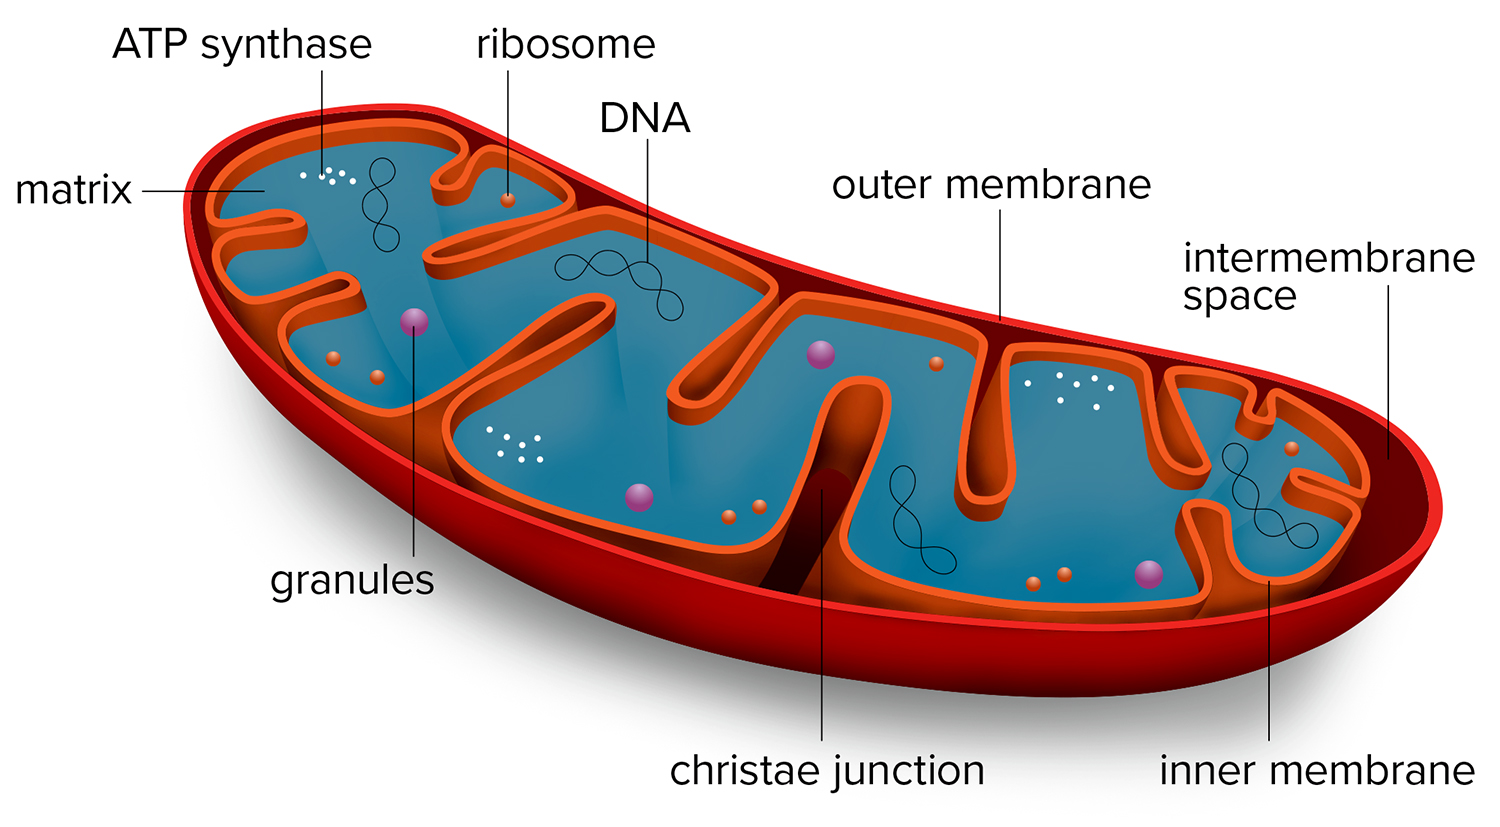
Mitochondria. (Nationalencyklopedin)
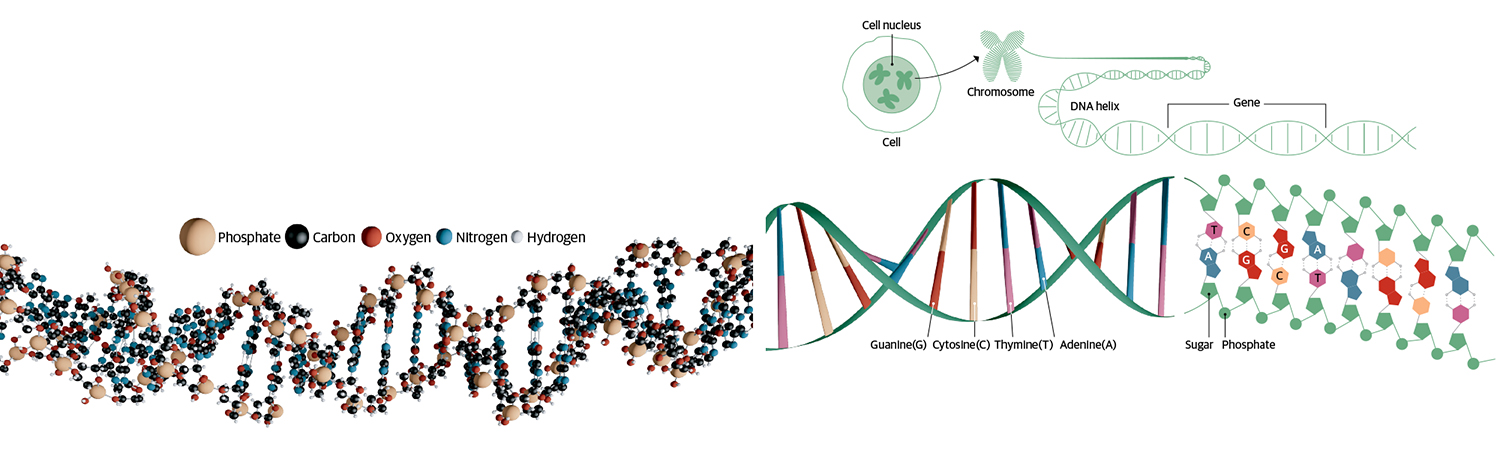
DNA.
Human Development Index. (Nationalencyklopedin)
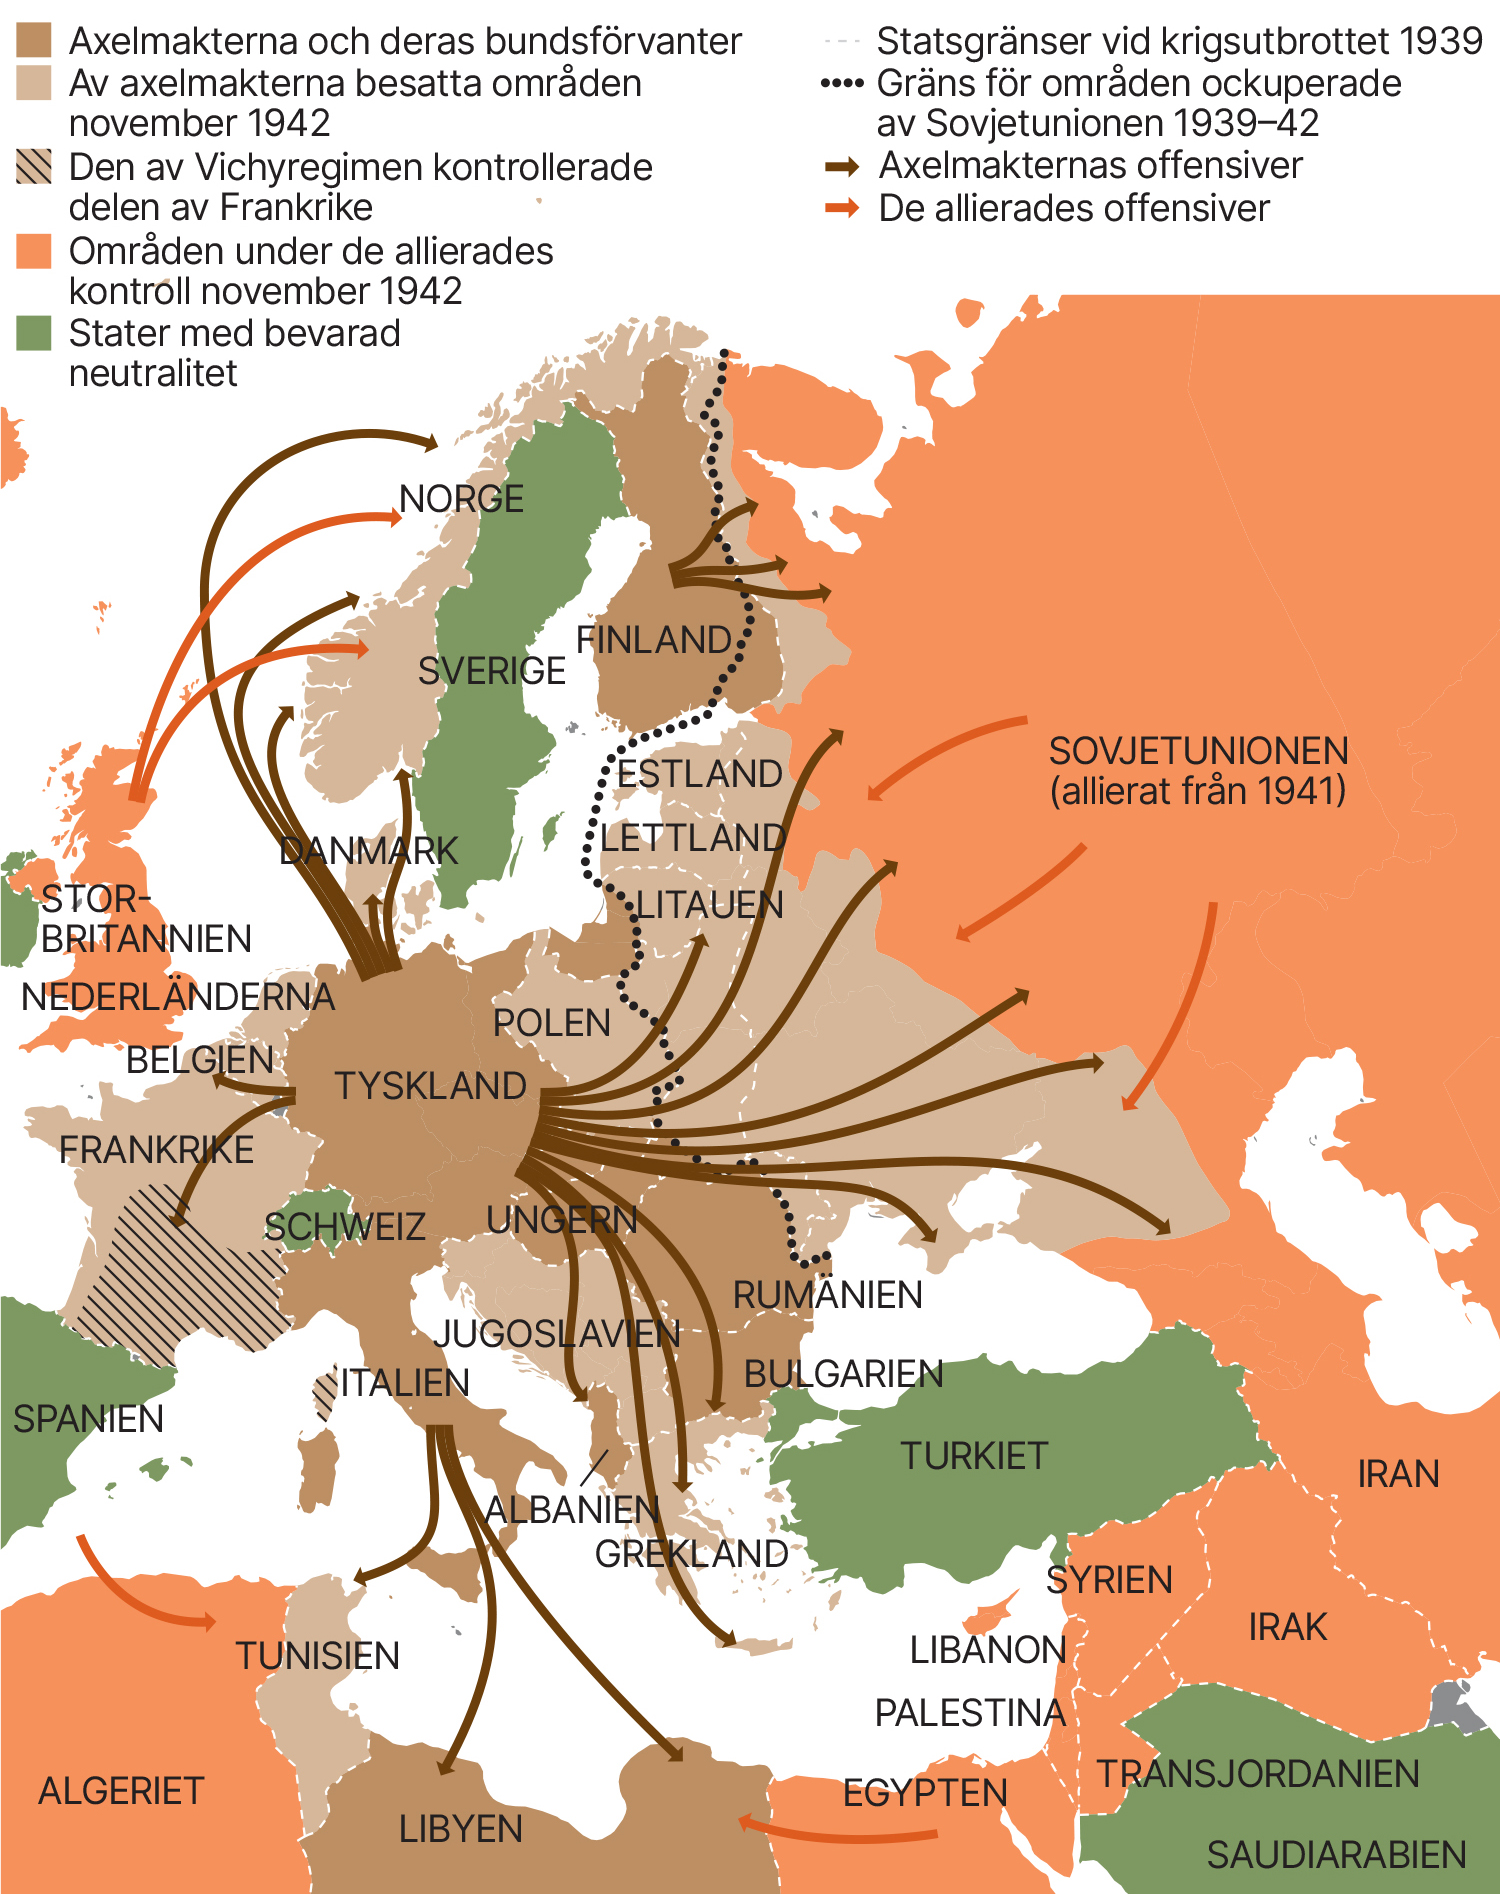
WW2. (Nationalencyklopedin)
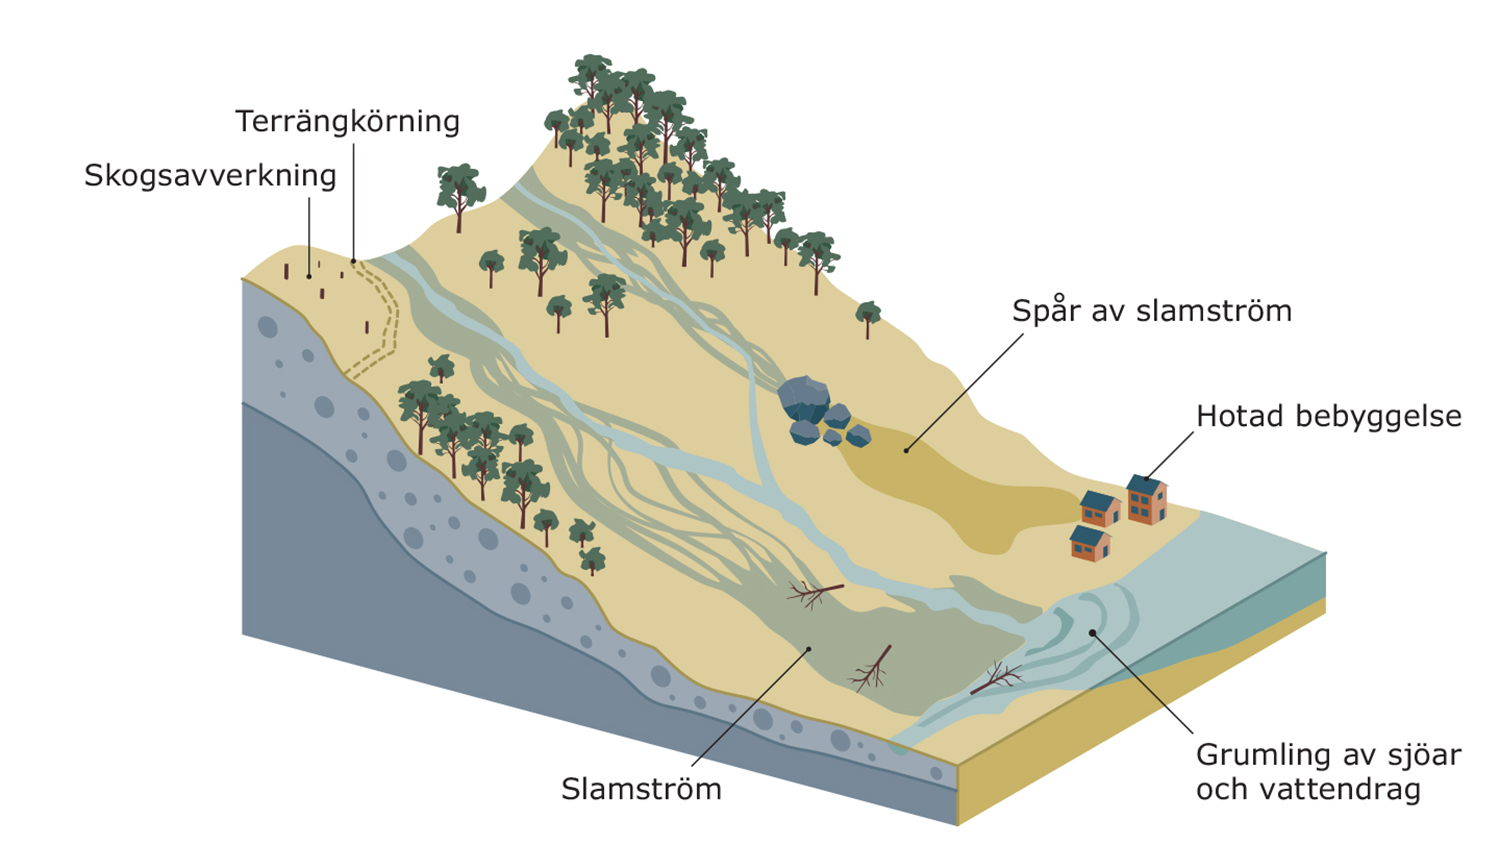
Felling. (SGI)
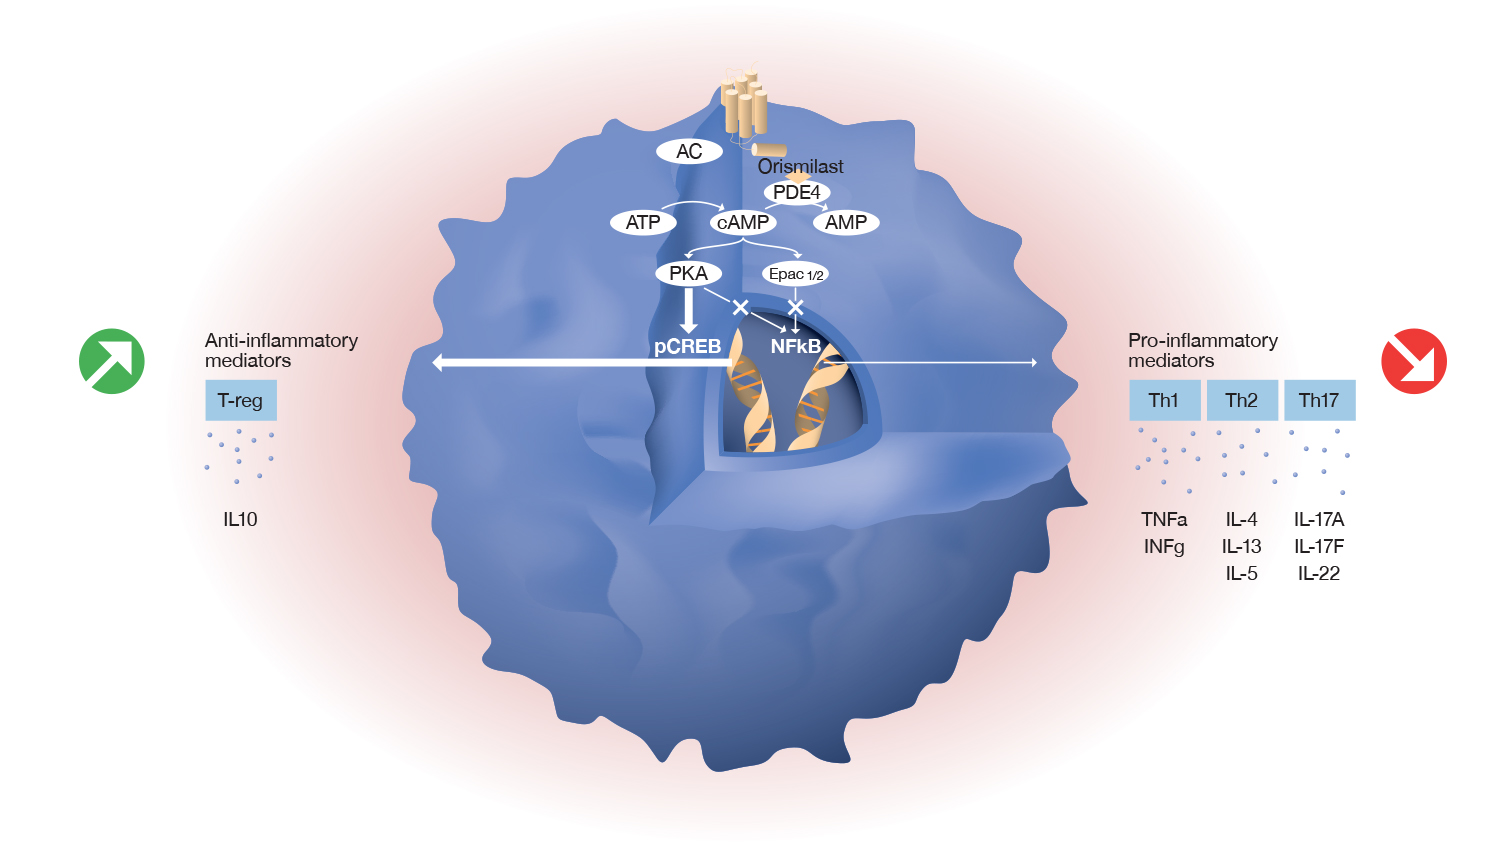
T-cell. (Union Therapeutics)
Savannah satellite survey. (Lunds Universitet).
The small intestine. (Funktion i fokus)
Instructional
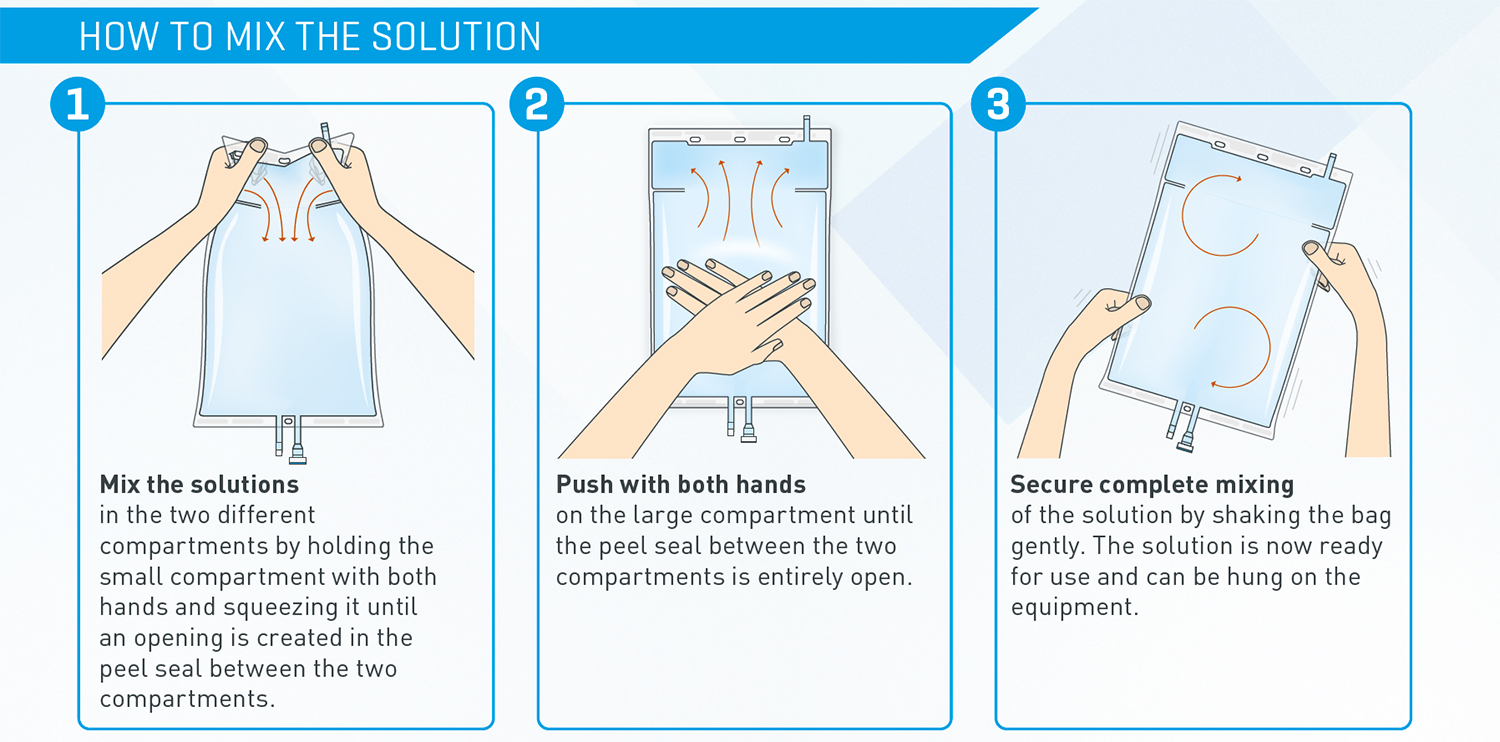
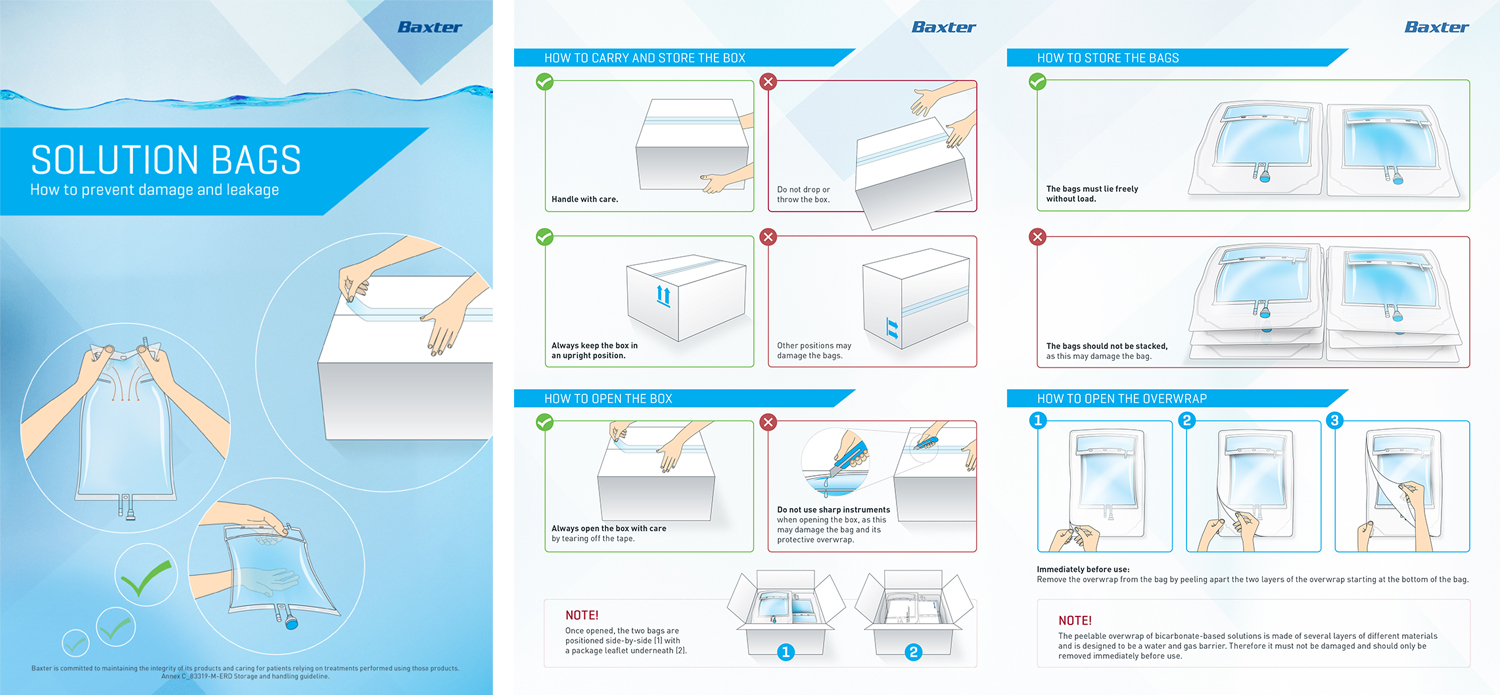
Baghandling instructions. (Baxter)
This is how the swedish church is organized. (Kyrkans Tidning)
The Swedish Exhibition & Congress Center.
Home gymnastics. (Svensk Polis)
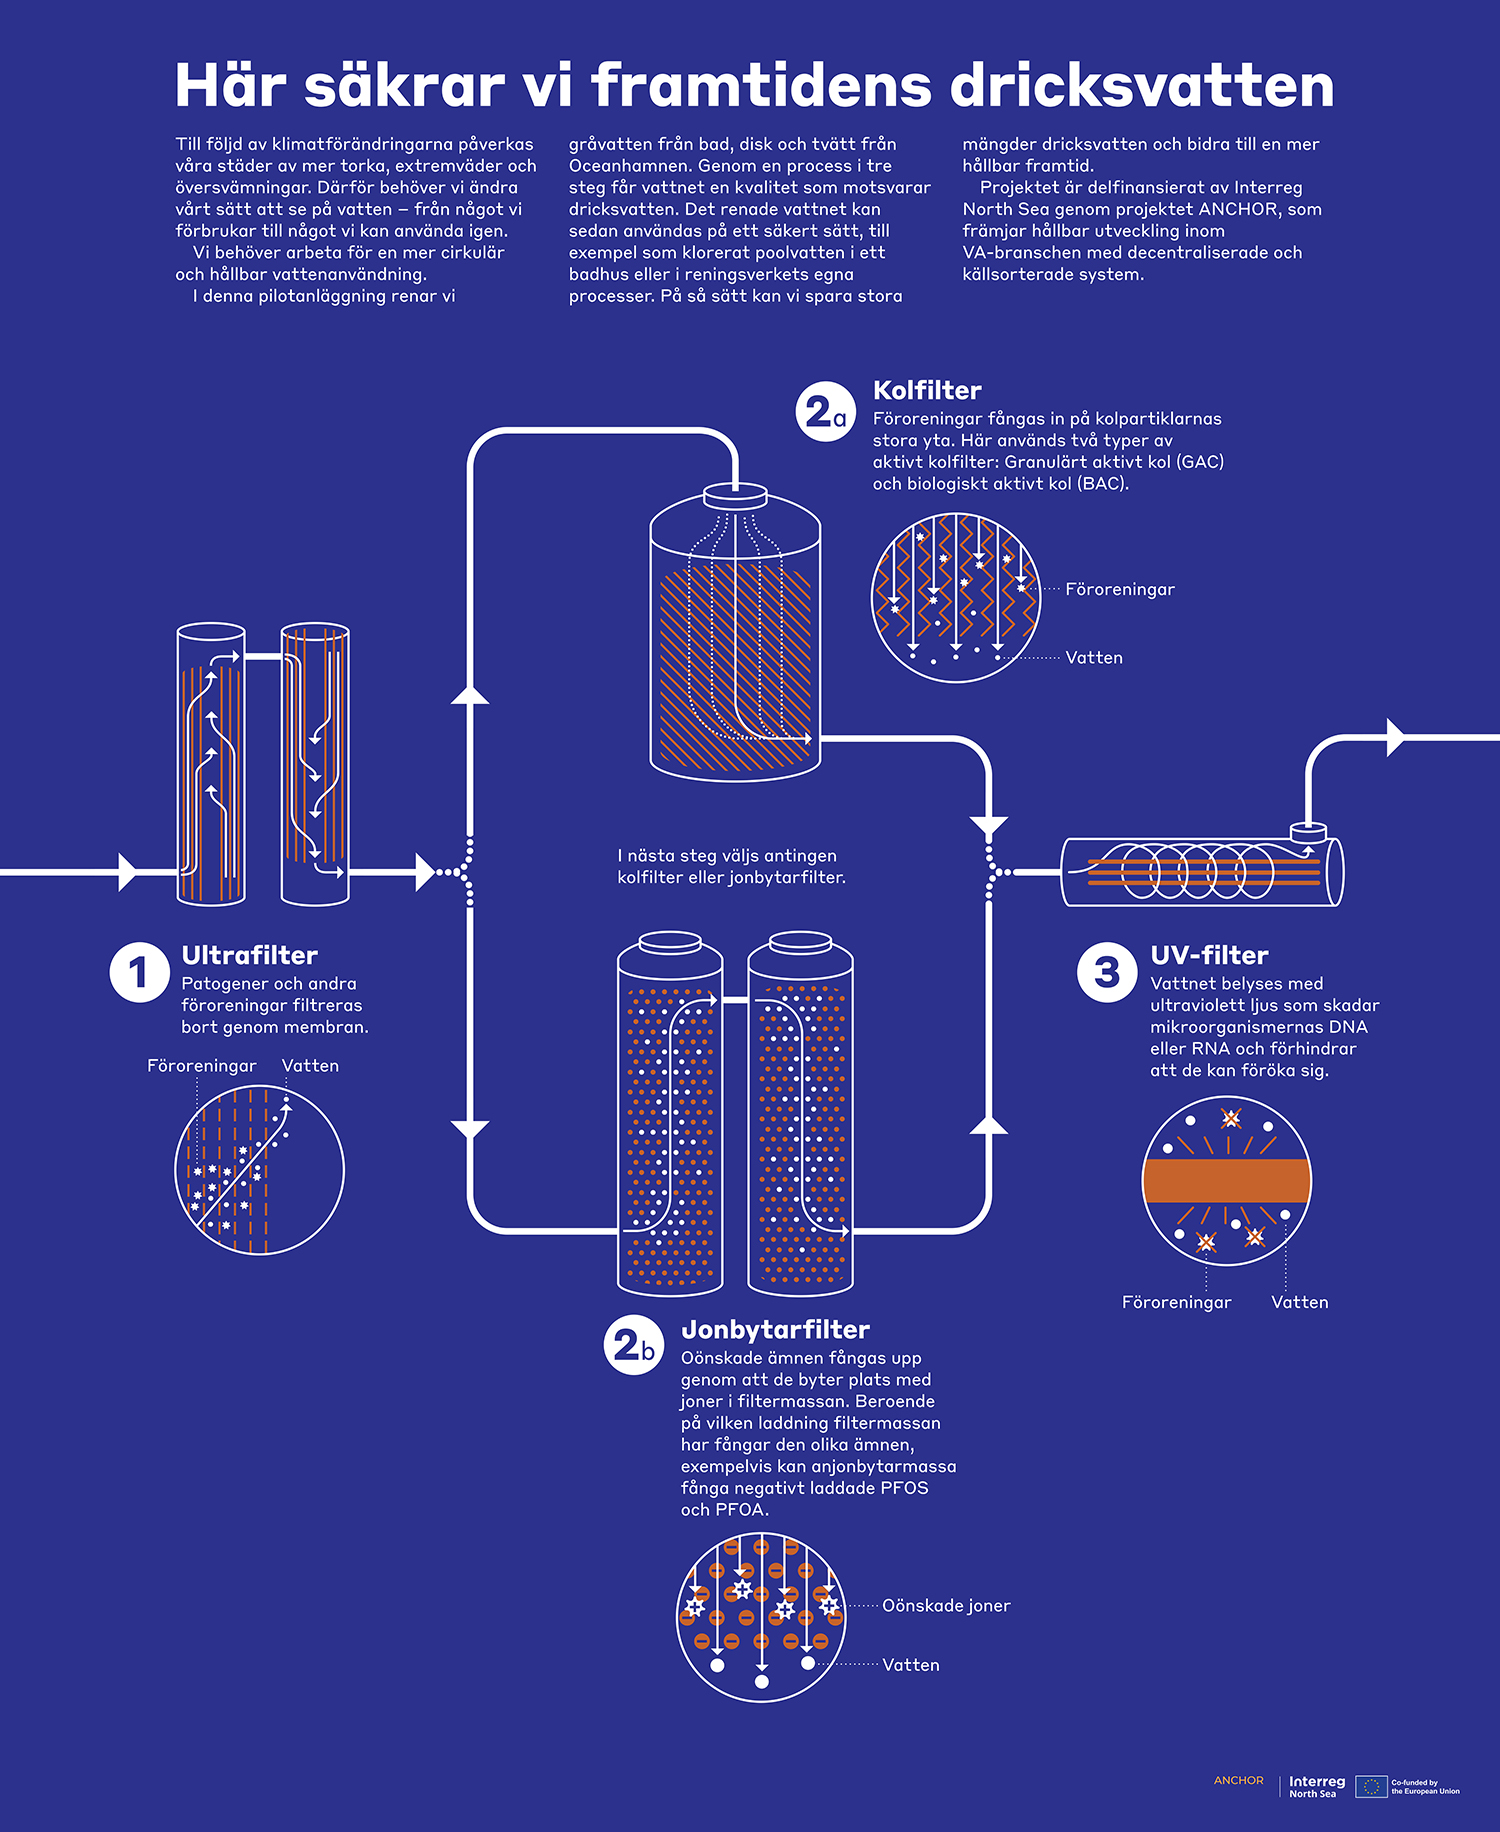
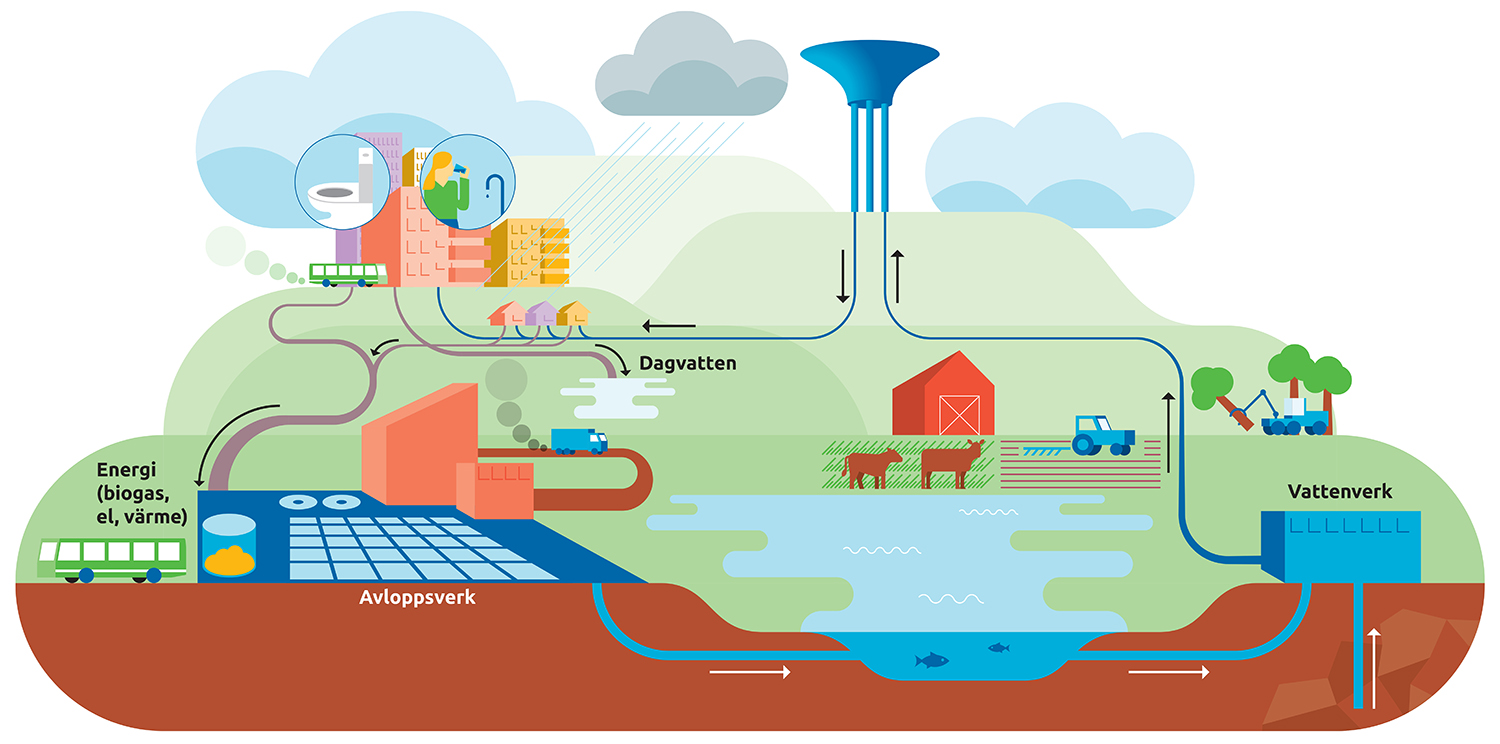
Drinking water processing. (NSVA)
Notice to households on how to protect themselves against fraudsters. (Polisen)
Illustrations for installation manual. (Aira)
Animations
Click to watch.
Showreel: examples of my animations.
Optiboost technology.
Newspaper history. (British Library)
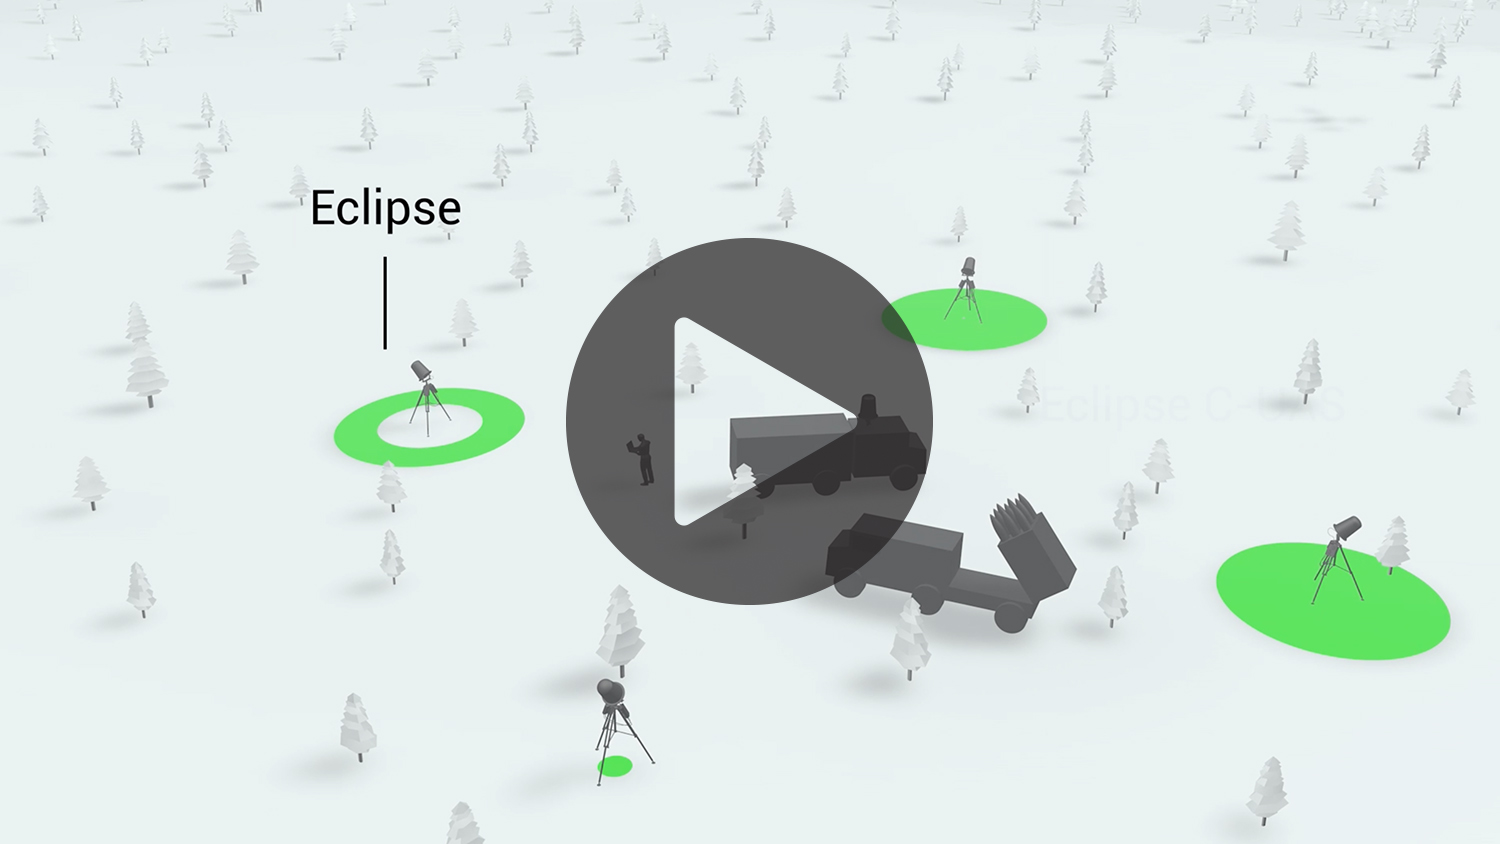
Radar technology. (Astor)
This is how a perpetrator can be traced using DNA genealogy. (Polisen)
LINK solutions. (LINK)
Cyber criminality. (Swedish Police)
This is how easy tubular heat exchangers are assembled. (Tetra Pak)
Cancer treatment technology. (Kristina Lång)
The future of sustainable fashion. (Profu/IVL Svenska Miljöinstitutet)
This is how map projections work.
Bag handling. (Baxter)
Newspaper history. (British Library)
Film footage and motion graphics about GPX Porosity. (Gasporox)
The technology at Phoenix Biopower.
This is how our energy system is connected. (Energiföretagen)
Preventive care. (SNS)
vChain technology. (vChain)
Gasporox business operations. (Gasporox)
IBEX system. (Volvo)
Oscillondome. (Mykonsult)
Interactive
Click to try.
Contribution to World Government summit visualization price.
Interactive circle of fifths as part of music education. Click your way around to spin the circle, and to play the chords and notes. (Nationalencyclopedin)
Chordplayer. Click to play chords, or drag and drop to try together with other chords. (Gleerups)
Zoomable graphic into cells. Drag the bar to zoom. (Gleerups)
The expansion of the roman empire. (Nationalencyklopedin)
Interactive map visualizing the British Library’s newspaper archive.
Interactive test to find out the users knowledge of how many students that cannot manage to graduate. (Lärarnas Riksförbund)
Interactive infographic showing the photosynthesis. (Gleerups)
Statistics showing how students fail to reach examination. (Lärarnas Riksförbund)
Geological timeline. (Nationalencyklopedin)
Interactive infographic showing levels of spinal damages. (Spinalis)
Interactive calculation of olive oil production. Drag the bars to adjust values. (Opticept)
Illustrations
Click to enlarge.
Growth or sustainability. (Syre)
Eco fascism. (Syre)
Illustrations about the conflicting emotions about being isolated – freedom and loneliness. (Göteborgs-Posten, Två Dagar)
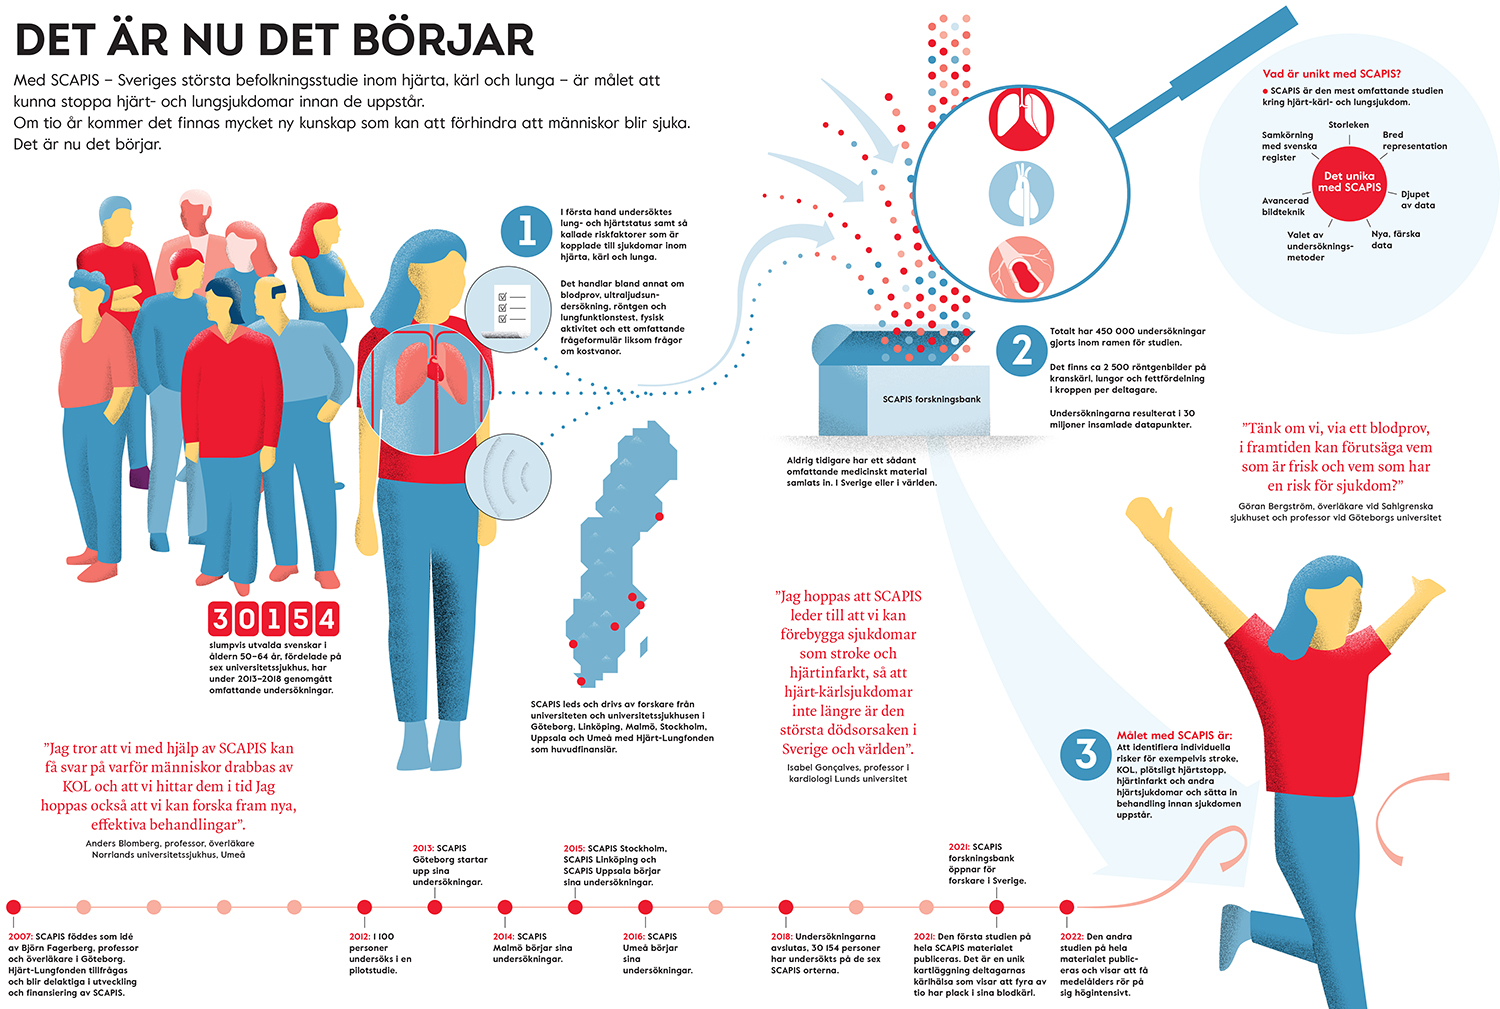
Program to prevent heart and lung diseases. (Hjärt- och Lungfonden)
Mobile addiction.
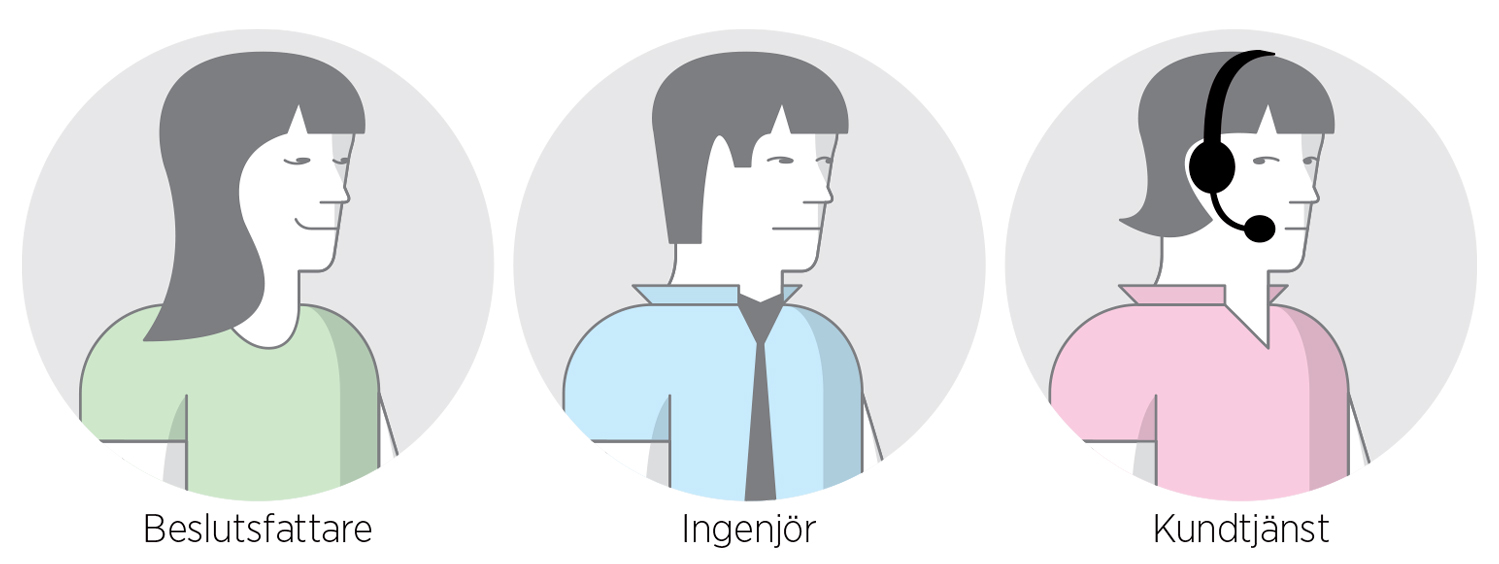
Figures.
Water system. (NSVA)
Background check. (Syre)
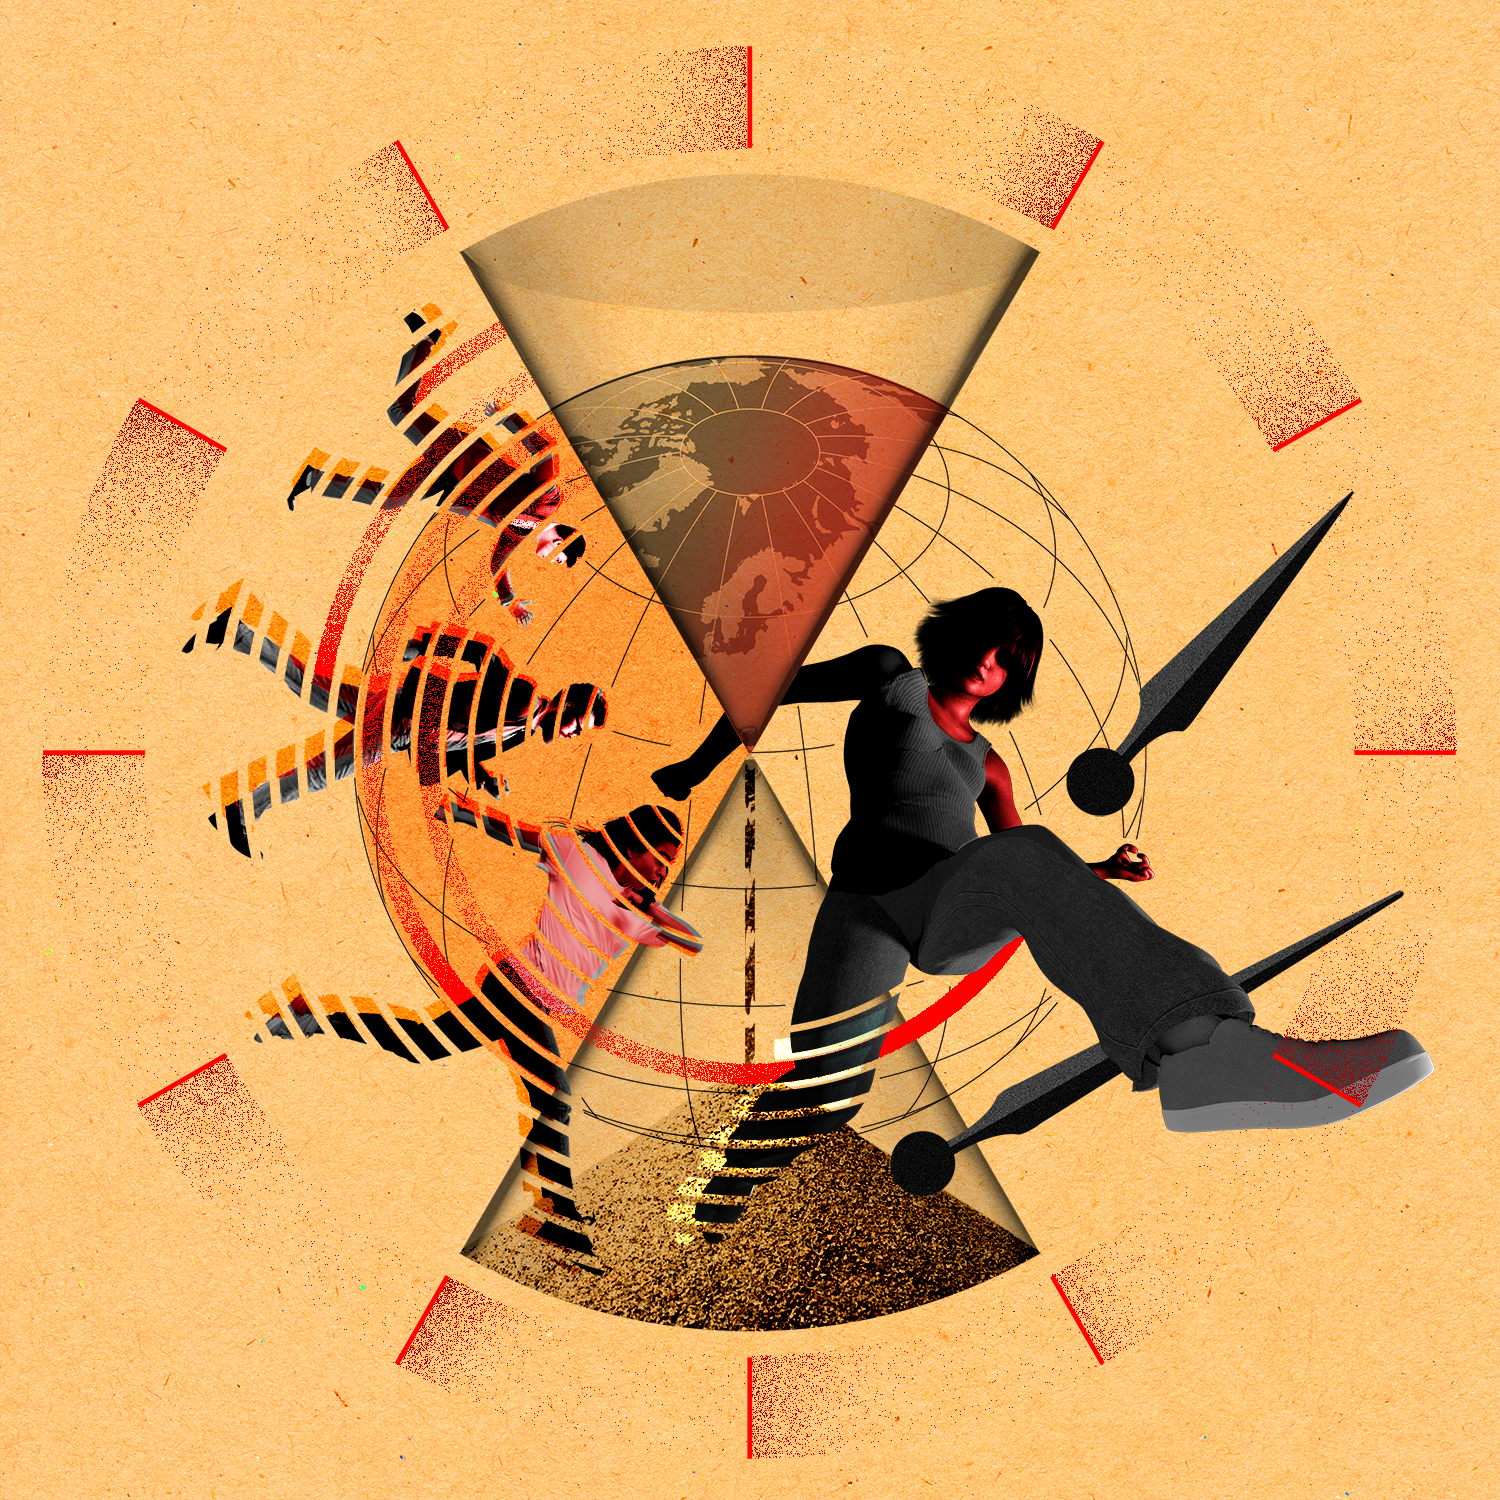
Time. (Tidningen Syre)
Grocery control. (LINK)
Propaganda as a weapon. (Sydsvenskan)
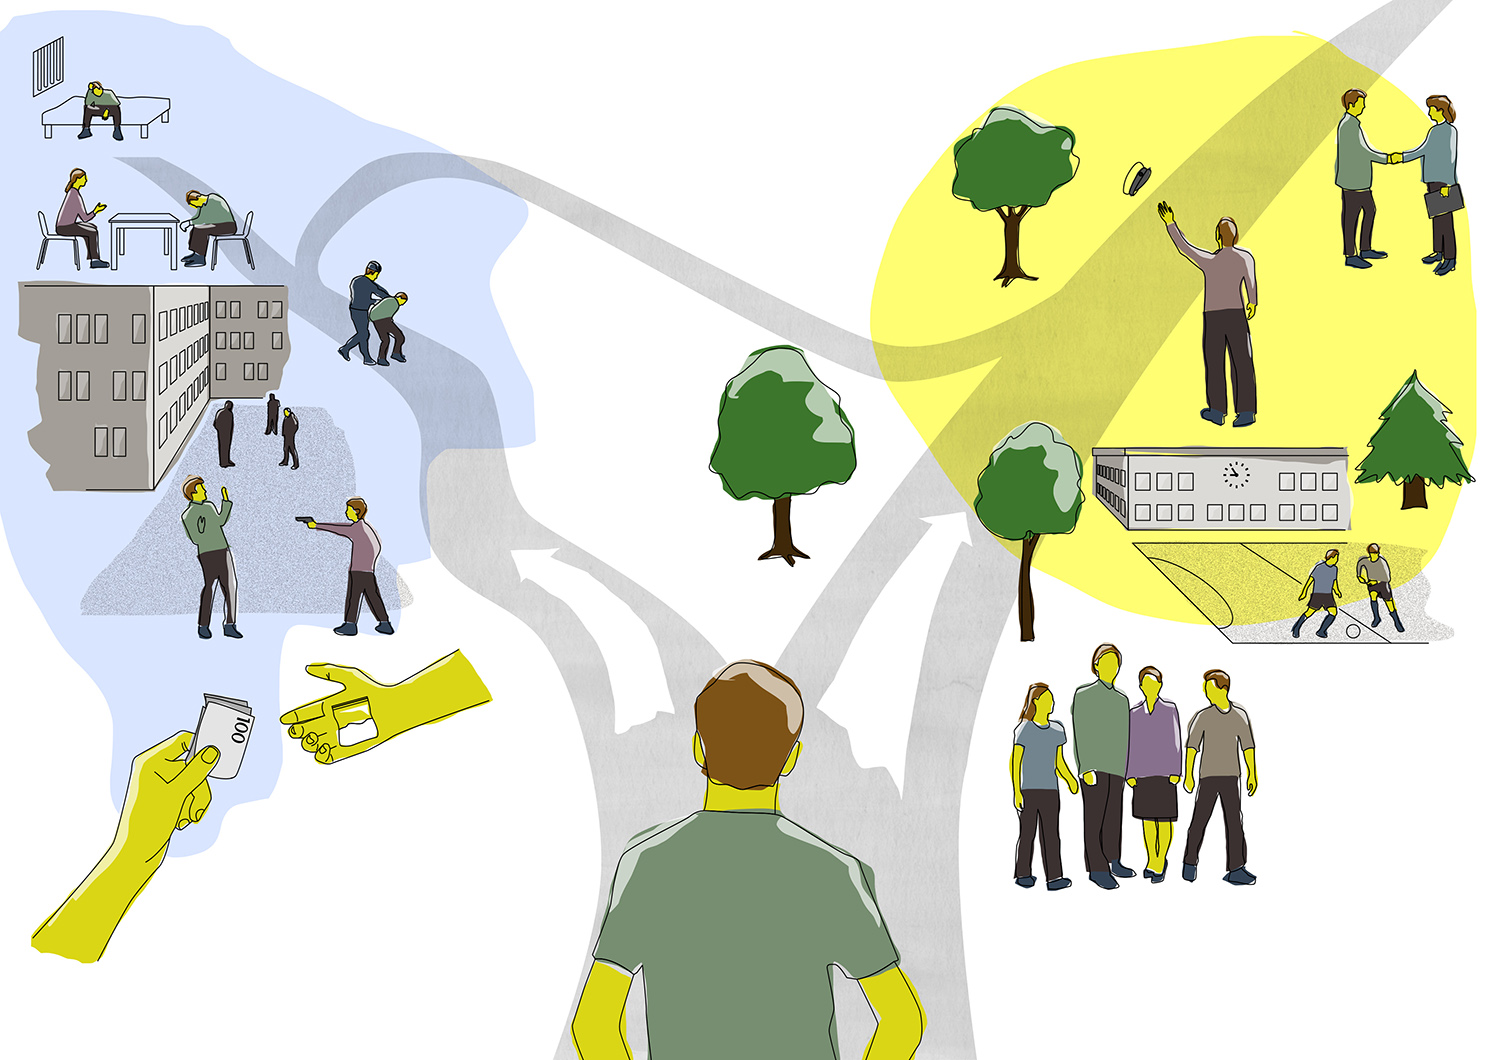
Choice of paths. (Polisen)
Future transport system. (BRA)
Layout
Click to enlarge.
Book production for Mag- och tarmförbundet. Author Anne Lichtenstein. Book cover, layout and infographics.
Book production for Henrik Bredberg and Jan F H Kockum. Layout, illustration and cover.
Baghandling instructions. Illustrations and layout. (Baxter)
Brochure for Carnegie, showing the companys funds. Design, layout and infographics. (Carnegie Fonder)
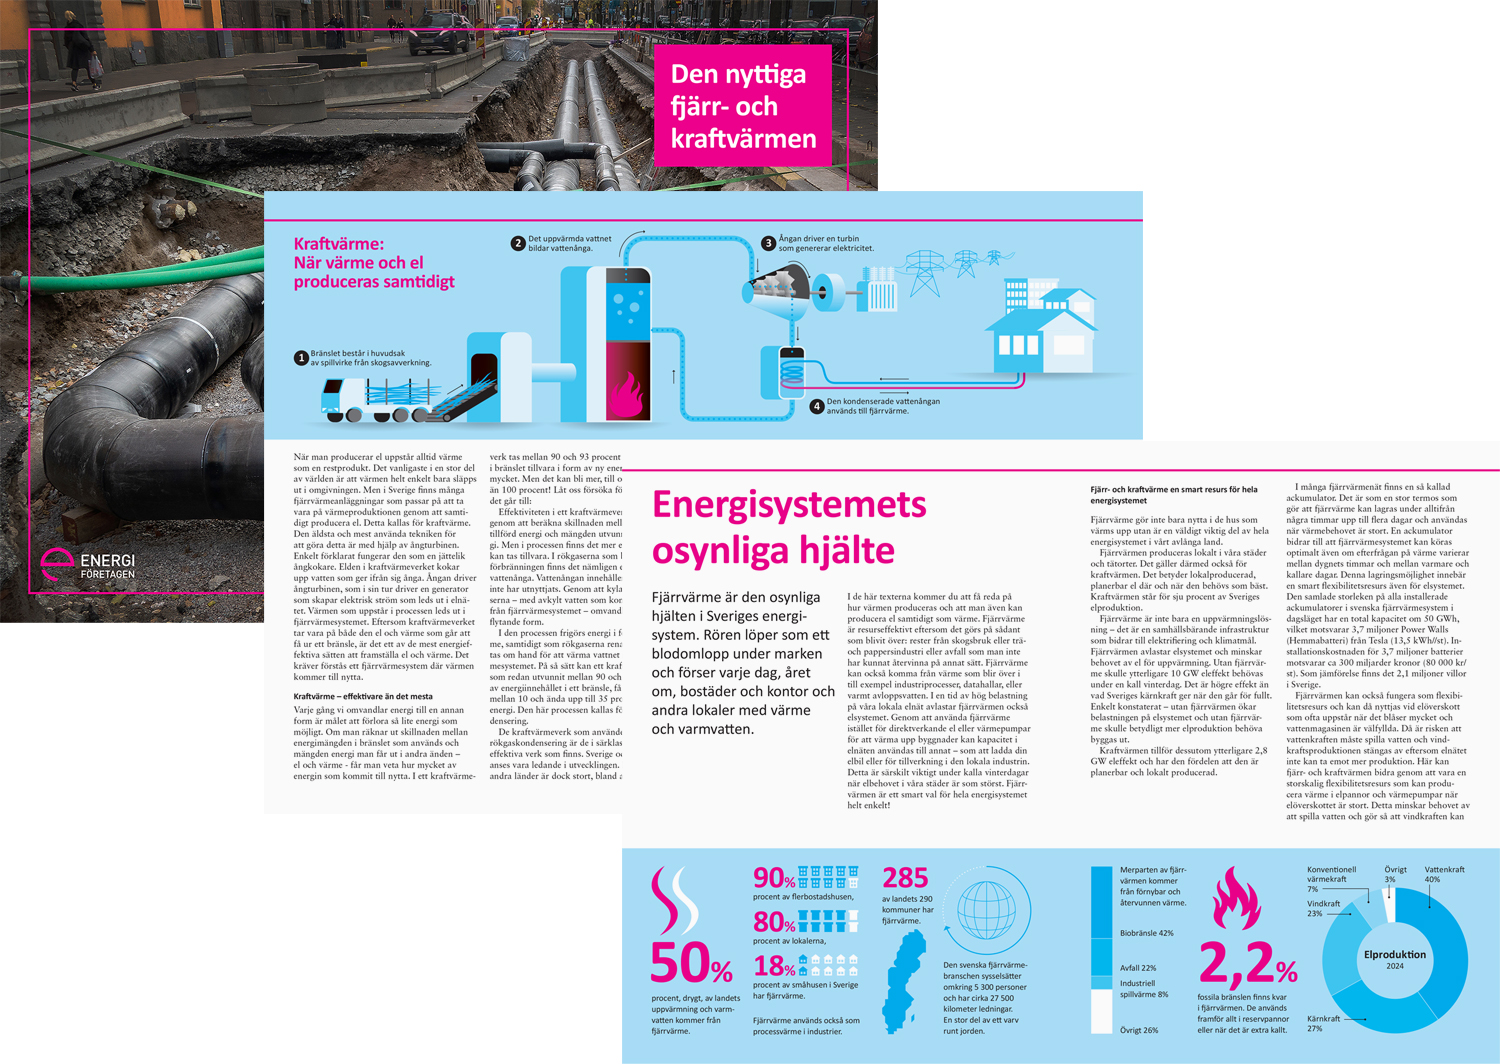
District heating. Infographics and layout. (Energiföretagen)
Hello!
I work with graphic design, more specifically infographics and illustrations, in my company VisualizeThat. I create material for print and web, that is to say also interactive graphics and animations.
My clients range from media, educational material producers, authorities and companies.
In other words, I have experience with many different types of customers, purposes and target groups.
I have a background as a visual journalist since 2001, before starting my company in 2012.

Erik Nylund
Owner
VisualizeThat
Organization number 5590677802