Toggle menu
+46 (0)702 456 053
info@eriknylund.se
About
Home
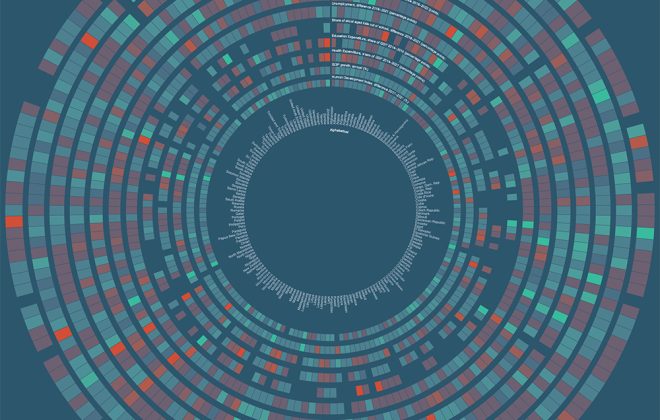
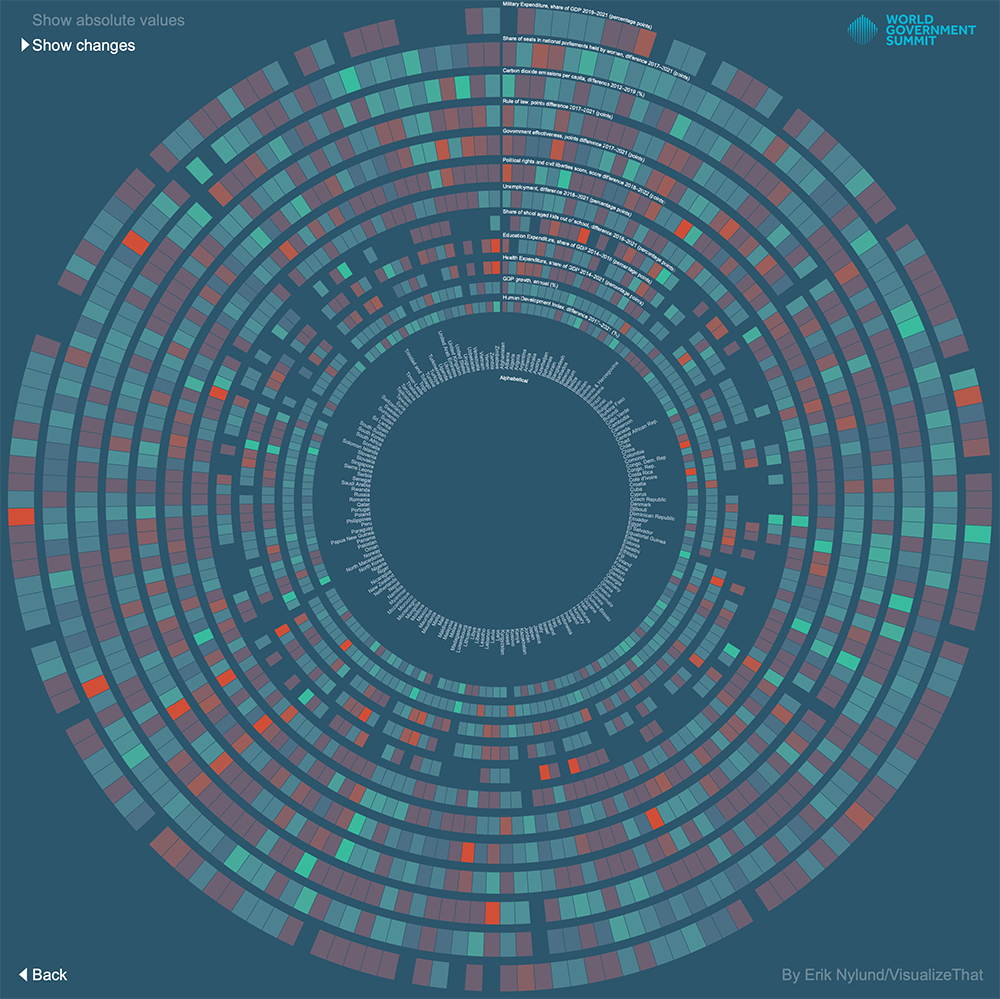
Click link symbol to try: Contribution to World Government summit visualization price.
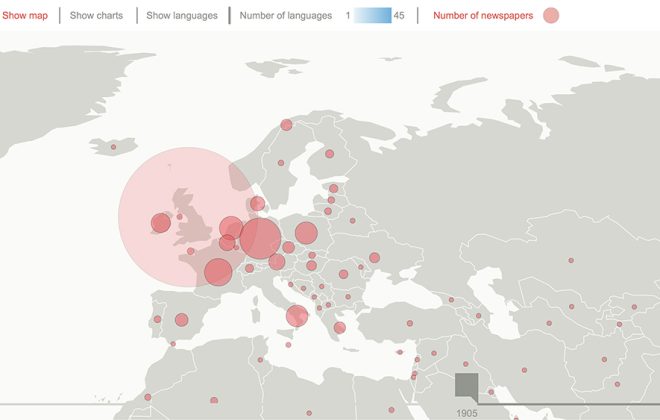
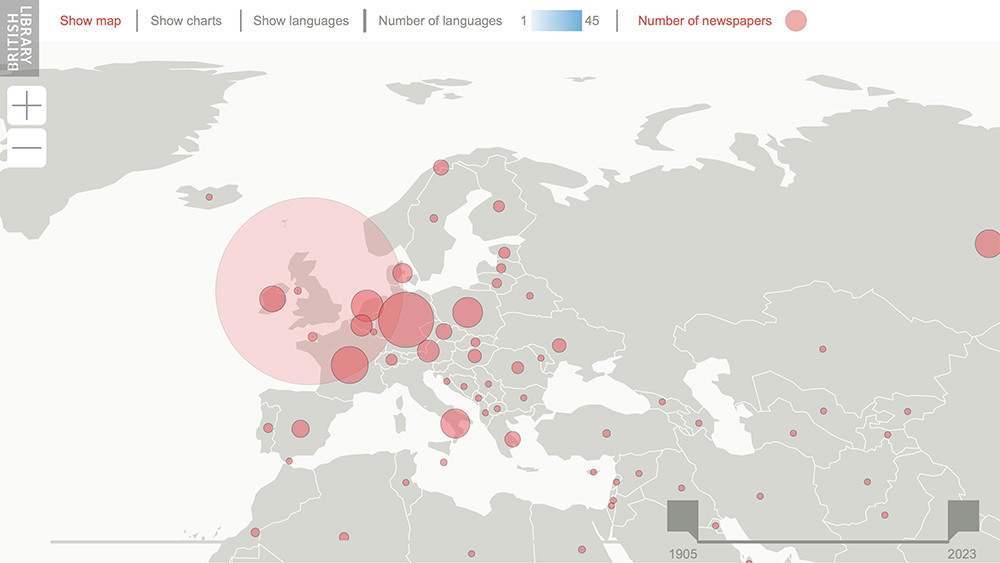
Click link symbol to try: Interactive map visualizing the British Library's newspaper archive.
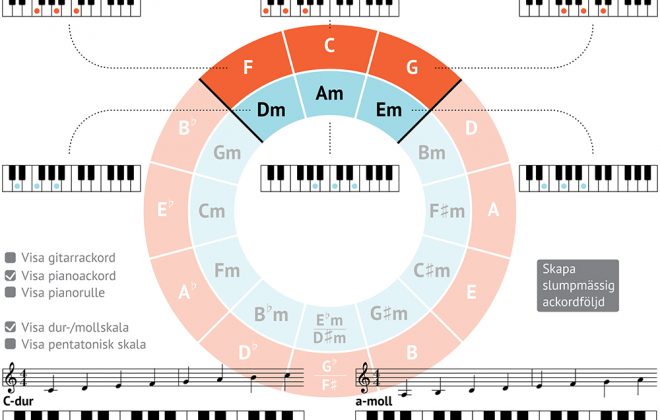
Click link symbol to try: Interactive circle of fifths as part of music education. (Nationalencyclopedin)
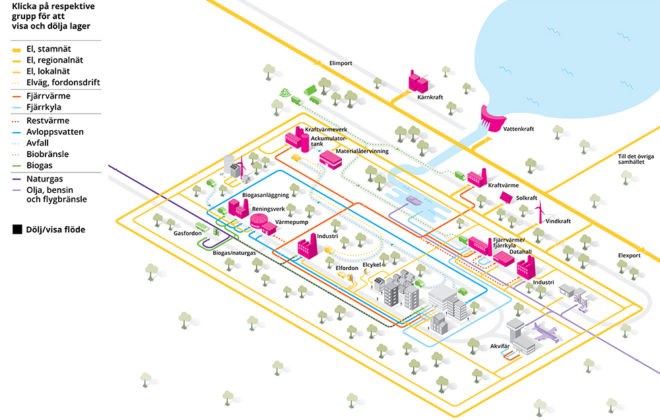
Click link symbol to try: Interactive graphic that shows sources of energy. (Energiföretagen)
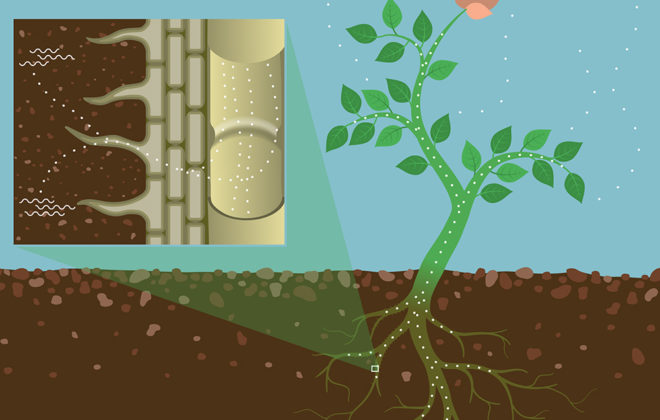
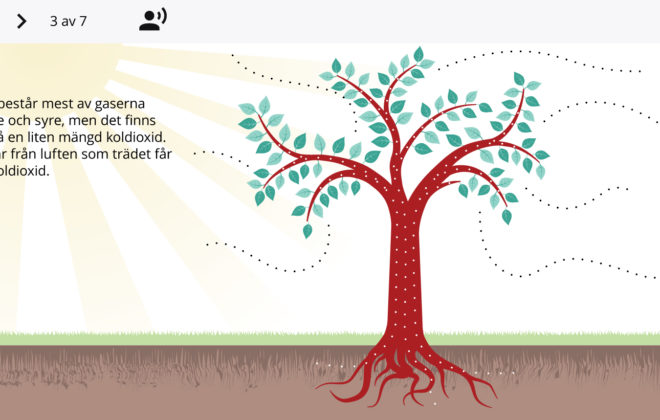
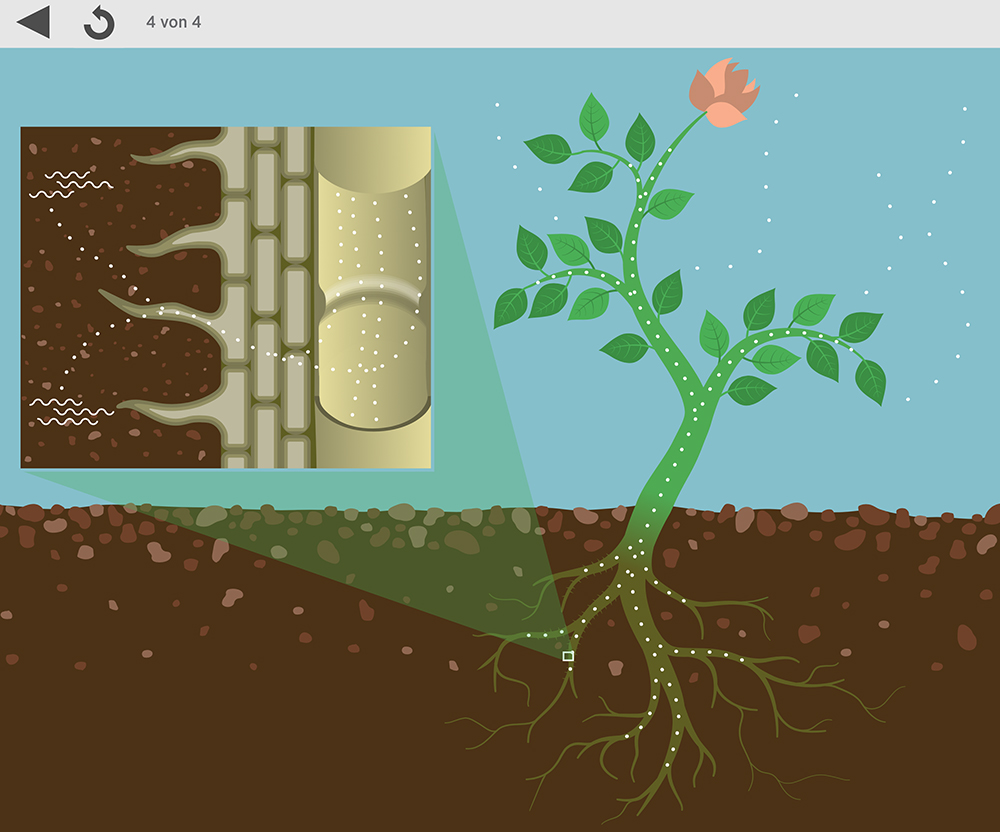
Click link symbol to try: Interactive graphic that shows how a plant sucks water and…
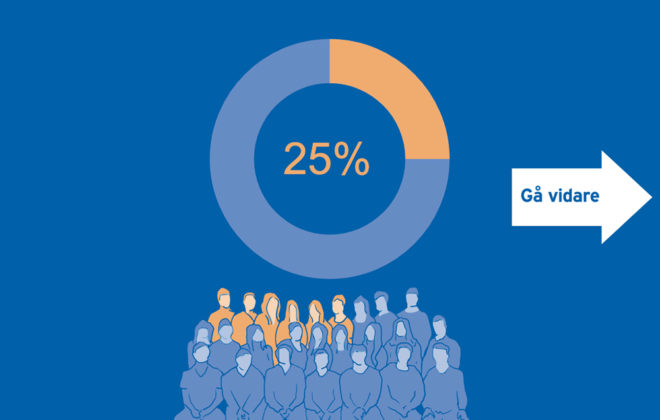
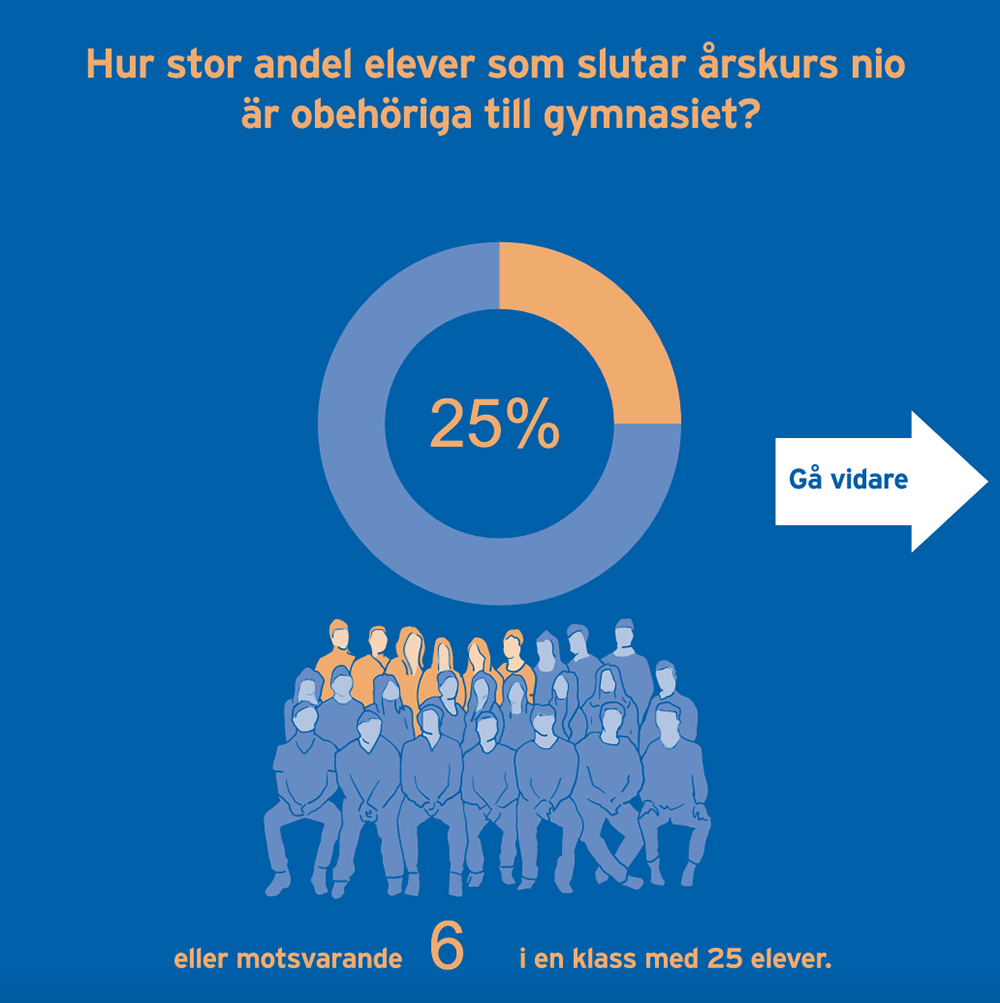
Click link symbol to try: Interactive test to find out the users knowledge of how…
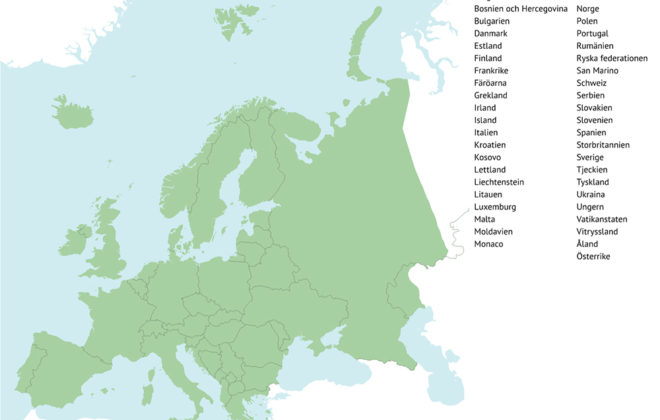
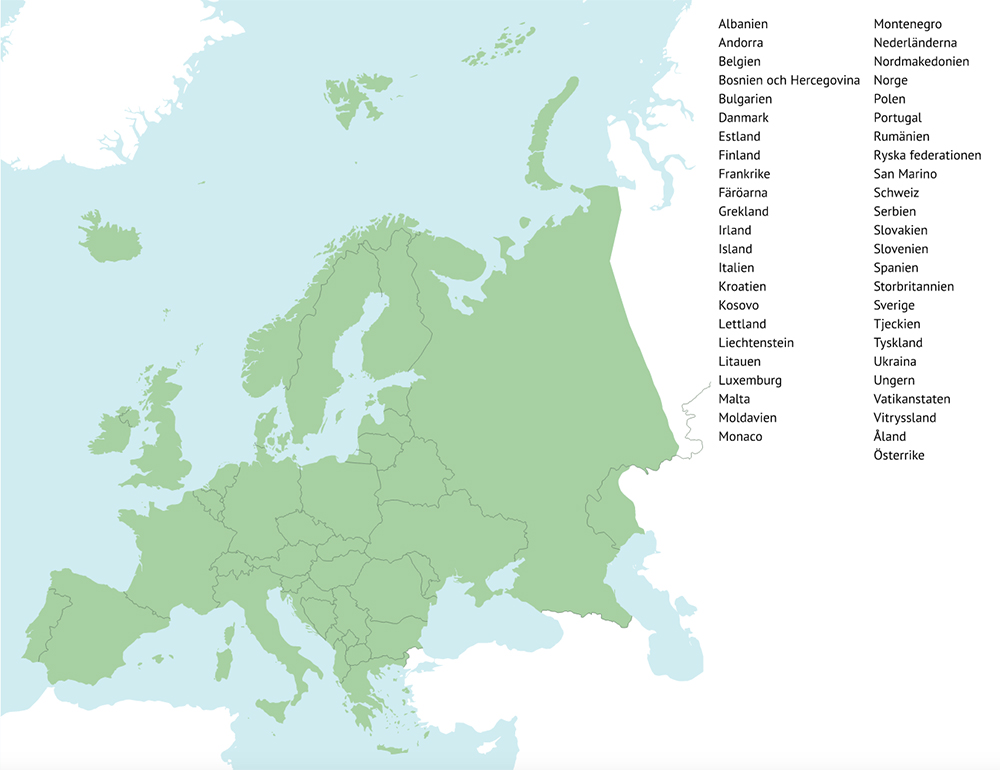
Click link symbol to try: Interactive map. (Nationalencyklopedin)
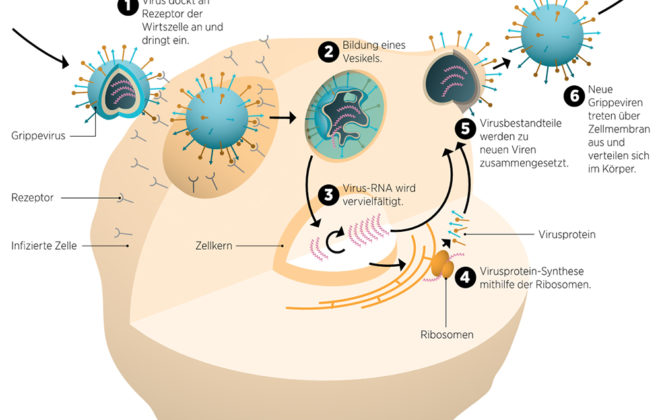
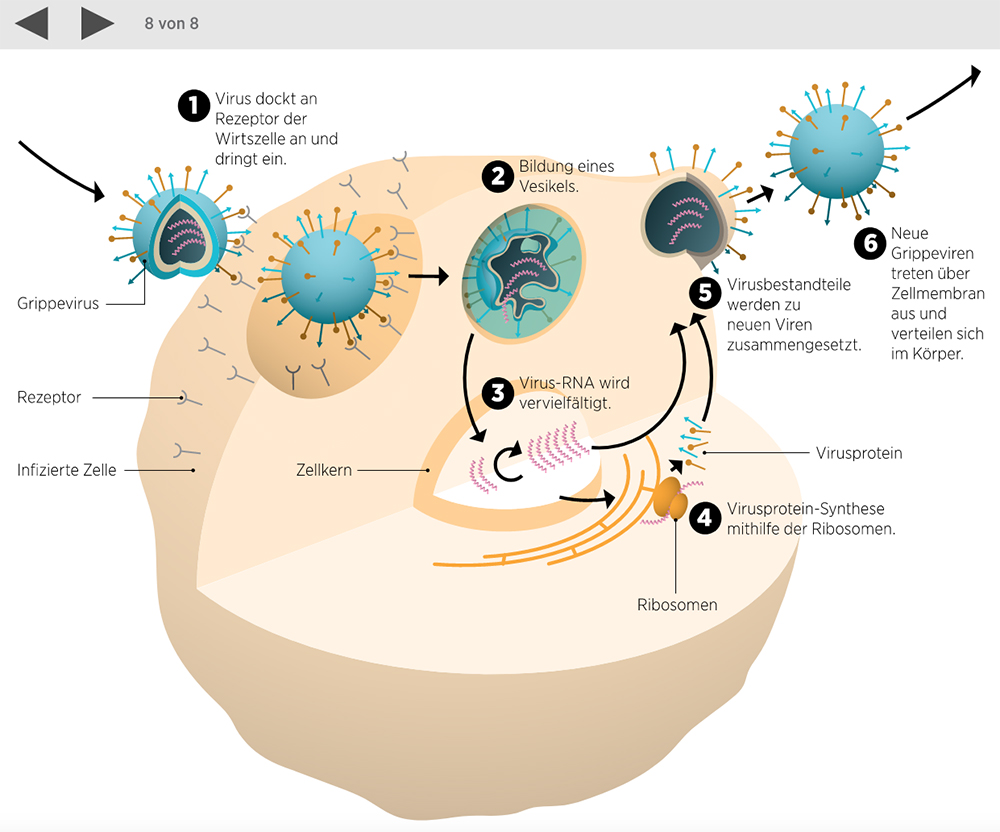
Click link symbol to try: Interactive infographic how a influenza virus docks a cell. (Brockhaus)
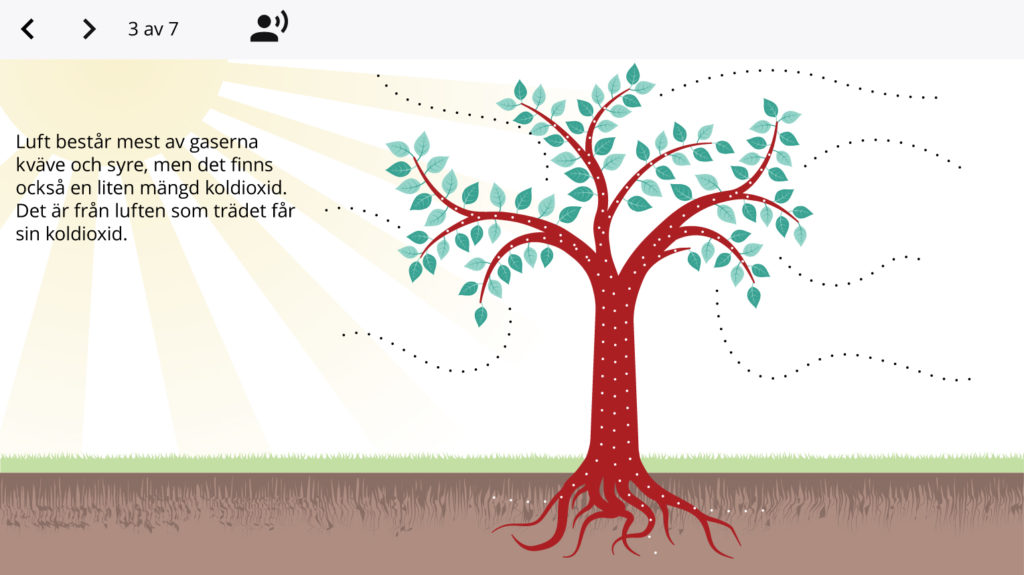
Click link symbol to try: Interactive infographic showing the photosynthesis. (Gleerups)
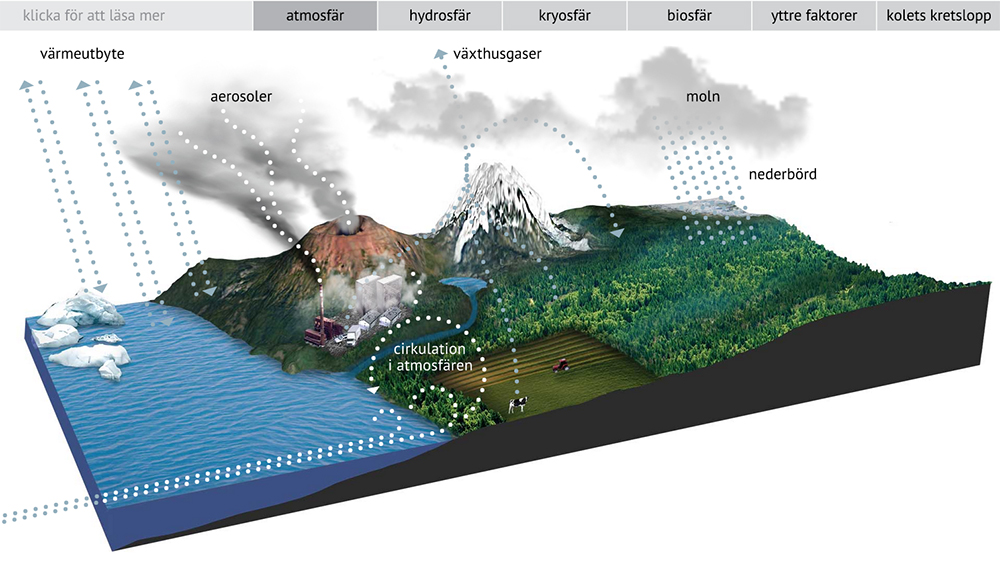
Click link symbol to try: Interactive infographic showing the climate system. (Nationalencyklopedin)
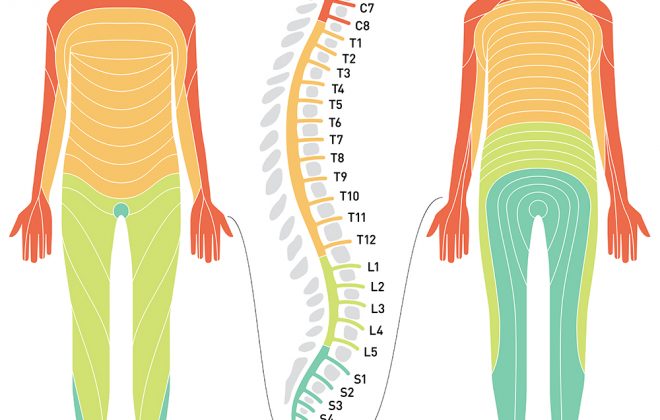
Click link symbol to try: Interactive infographic showing levels of spinal damages. (Spinalis)
1
2
Next
